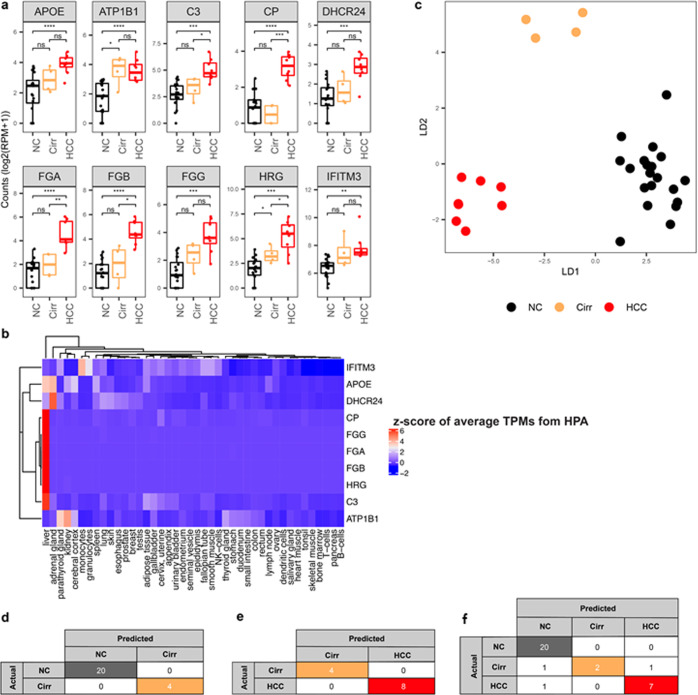
Fig. 3. cfRNA profiles distinguish between non-cancer, liver cirrhosis, and liver cancer donors.
a Boxplots of representative top ten most significant genes resulted from the LVQ analysis for HCC vs. NC. P value was calculated for each pair by the t-test. Center-line indicates the median value across all patients in that group, and the hinges represent the lower (Q1) and upper (Q3) quartile, with whiskers extending to the minimum and maximum of the resulting distribution. b Heatmap of z-score across publicly available tissue-level expression data from the Human Protein Atlas (HPA) for the top ten LVQ genes identified in HCC vs. NC (c) LDA plot using top ten genes identified from each pairwise analysis between NC - Cirr and NC - HCC samples using the LVQ method. d–f LOOCV using the RF model with top ten LVQ genes to discriminate Cirr and NC (d), HCC vs Cirr (e), and three groups NC, Cirr, and HCC (f). Genes included in the RF analysis are listed in Supplementary Table 5.

