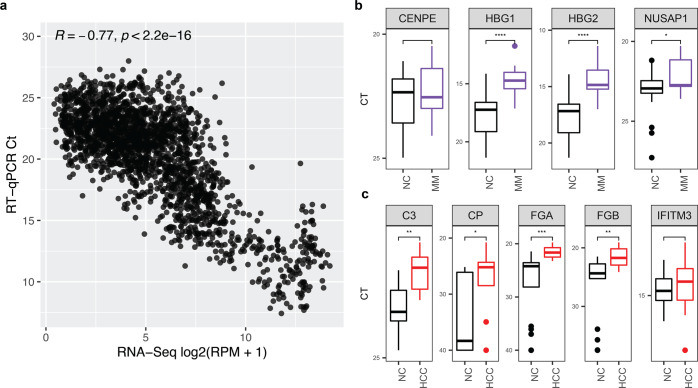
Fig. 4. qRT-PCR of cfRNA biomarkers is concordant with RNA-sequencing data.
a Correlation plot of qRT-PCR data compared to RNA-sequencing data. P value was calculated by t-test. b, c qRT-PCR Ct values of top four LVQ genes identified from MM versus NC (b) and top 5 LVQ genes identified from HCC versus NC (c). Center-line for boxplots in both b and c indicates the median value across all patients in that group, and the hinges represent the lower (Q1) and upper (Q3) quartile, with whiskers extending to the minimum and maximum of the resulting distribution.

