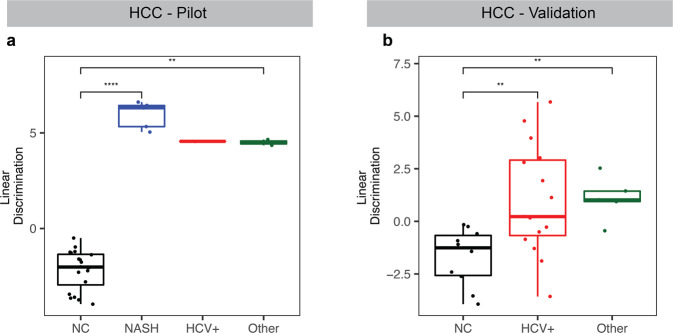
Fig. 7. cfRNA biomarkers for HCC show discrimination between various etiologies.
a Linear discriminant analysis trained on the pilot cohort with the top ten LVQ genes show significant discrimination between NC and HCC on the background of NASH, HCV+, and other etiologies in the pilot cohort and the validation cohort (b). P value for each pair was calculated by the Wilcoxon rank-sum test. Center-line in each boxplot indicates the median value across all patients in that group, and the hinges represent the lower (Q1) and upper (Q3) quartile, with whiskers extending to the minimum and maximum of the resulting distribution.

