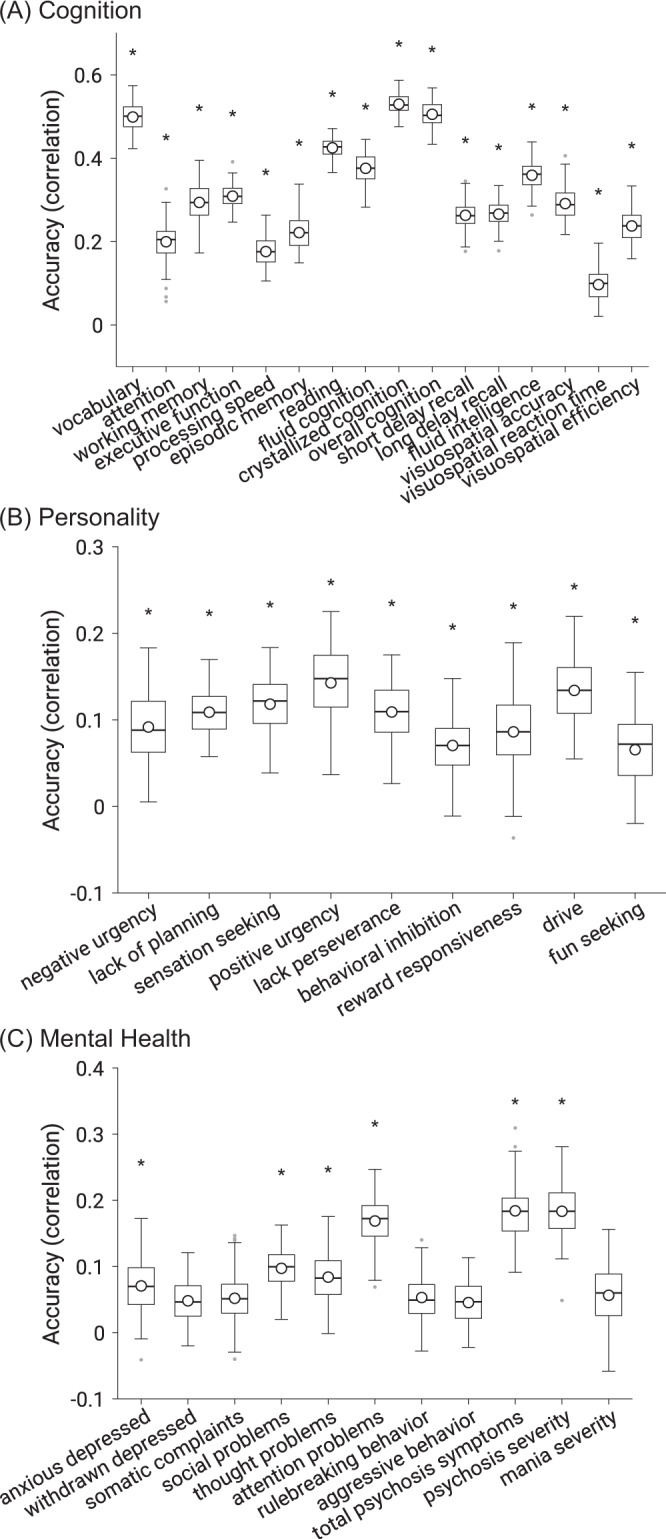
Fig. 3. Cross-validated prediction performance (Pearson’s correlation between observed and predicted values) using multikernel ridge regression by exploiting resting FC, MID-FC, SST-FC, and N-back FC jointly.

A Cognitive measures. B (Impulsivity-related) Personality measures. C Mental health measures. * denotes above-chance prediction after correcting for multiple comparisons (FDR q < 0.05). The boxplots show the accuracy across 120 replications. Note the different scales across the three panels. The same set of behavioral measures were predicted better than chance when using coefficient of determination (COD) instead of Pearson’s correlation as a measure of prediction performance (Supplementary Fig. 2). Boxplot convention is the same as Fig. 2. Source data are provided as a Source Data file.
