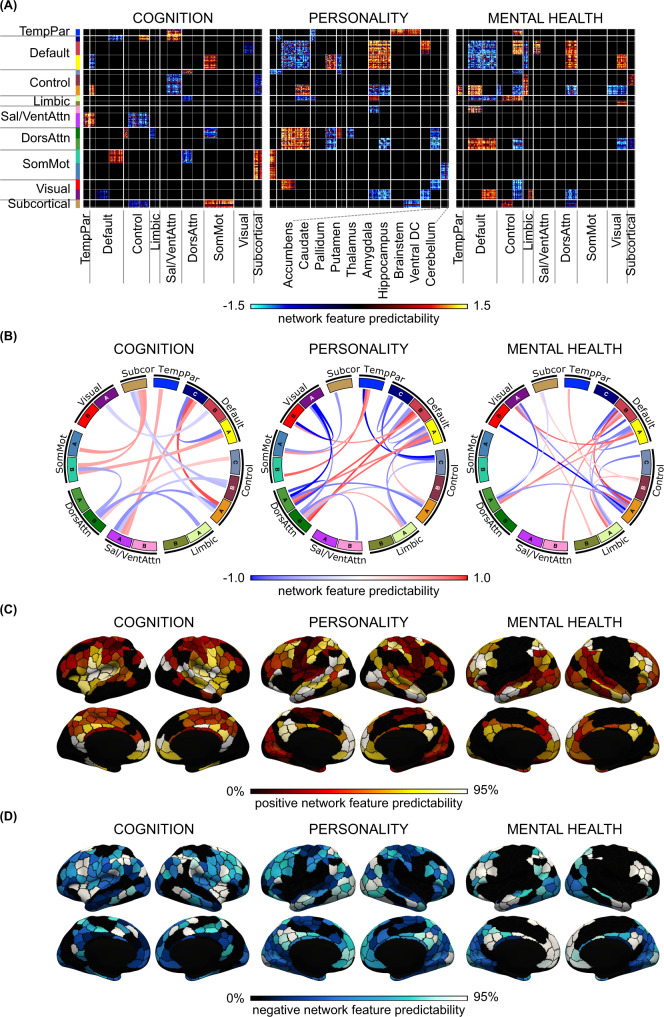
Fig. 8. Brain-network features that support individual-level prediction of cognition, personality, and mental health.
A Predictive-feature matrices averaged across brain states, considering only within-network and between-network blocks that were significant across all four brain states (rest, MID, SST, and N-back). B Predictive-network connections obtained by averaging the matrices in panel (A) within each between-network and within-network block. C Positive predictive features obtained by summing positive predictive-feature values across the rows of panel (A). A higher value for a brain region indicates that stronger connectivity yielded a higher prediction for the behavioral measure. D Negative predictive features obtained by summing negative predictive-feature values across the rows of panel (A). A higher value for a brain region indicates that weaker connectivity yielded a greater prediction for the behavioral measure. In both panels (C) and (D), the color of each parcel corresponds to the percentile of predictive-feature values among 400 parcels. See Supplementary Fig. 13A for the subcortical maps. For visualization, the values within each predictive-feature matrix in panel A were divided by their standard deviations across all entries in the predictive-feature matrix. The current figure utilized hypothesis-driven behavioral domains. Conclusions were highly similar using data-driven behavioral clusters (Supplementary Figs. 15 and 16), as well as other control analyses (Supplementary Figs. 21–23).

