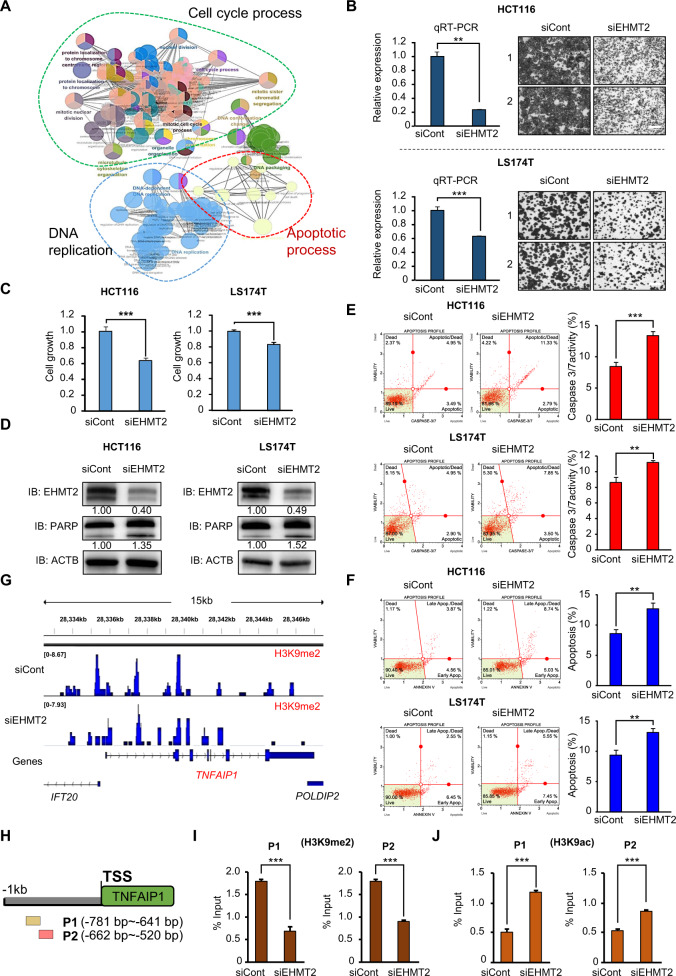
Fig. 4. Knockdown of EHMT2 is involved in CRC apoptosis.
A GO pathway term enrichment networks. GO pathway term networks in the EHMT2 knockdown and control groups were functionally grouped by ClueGO. Terms in the functionally grouped networks were cut off at p values > 0.05. B qRT-PCR analysis of EHMT2 after treatment with EHMT2 siRNA and siCont (negative control). p values were calculated using Student’s t-test (**p < 0.01) (left). Cell growth assay after treatment with siEHMT2 and siCont for 48 h. HCT116 and LS174T cells were fixed in 100% methanol and stained with crystal violet solution. Scale bar, 200 μm (right). C CCK-8 assay. CCK-8 solution was added to the culture medium after treatment with siEHMT2 and siCont, and the cells were incubated for 5 min at 37 °C. The intensity of cell growth was measured using a microplate reader (450 nm). p values were calculated using Student’s t-test (***p < 0.001). D Western blot analysis after EHMT2 knockdown using anti-EHMT2 and anti-PARP antibodies. ACTB was used as the internal control in HCT116 and LS174T cells. The signal intensities were quantified using ImageJ software. E FACS analysis using Muse Caspase 3/7 working solution was performed after EHMT2 knockdown. The upper right panel indicates the apoptotic and dead cell proportions (left). Quantification of caspase 3/7 activity. Mean ± SD of three independent experiments. p values were calculated using Student’s t-test (***p < 0.001, **p < 0.01) (right). F FACS analysis of Annexin V staining was performed after EHMT2 knockdown. The lower right and upper right quadrants indicate early apoptosis and late apoptosis (left), respectively. Quantification of apoptosis. Mean ± SD of three independent experiments. p values were calculated using Student’s t-test (**p < 0.01) (right). G ChIP-seq analysis. Representative IGV view of the H3K9me2 (siCont) and H3K9me2 (siEHMT2) ChIP signals in the promoter region of a TNFAIP1 gene. The promoter region was defined as the region from the transcription start site (TSS) to 1 kb upstream of the TSS. The Y-axis scale reflects the normalized number of reads using RPGC (number of reads per 10 bp/scaling factor for 1× average coverage) of deepTools (v3.3.0). The normalized scales are 0–8.67 for H3K9me2 (siCont) and 0–7.93 for H3K9me2 (siEHMT2). H Graphical abstract for ChIP primer design on the TNFAIP1 promoter region. I, J The ChIP assay was performed using anti-H3K9me2 (I) and anti-H3K9ac (J) antibodies. The results are expressed as a percentage of input chromatin compared with the control in HCT116 cells after siEHMT2 treatment. Mean ± SD of three independent experiments. p values were calculated using Student’s t-tests (***p < 0.001).

