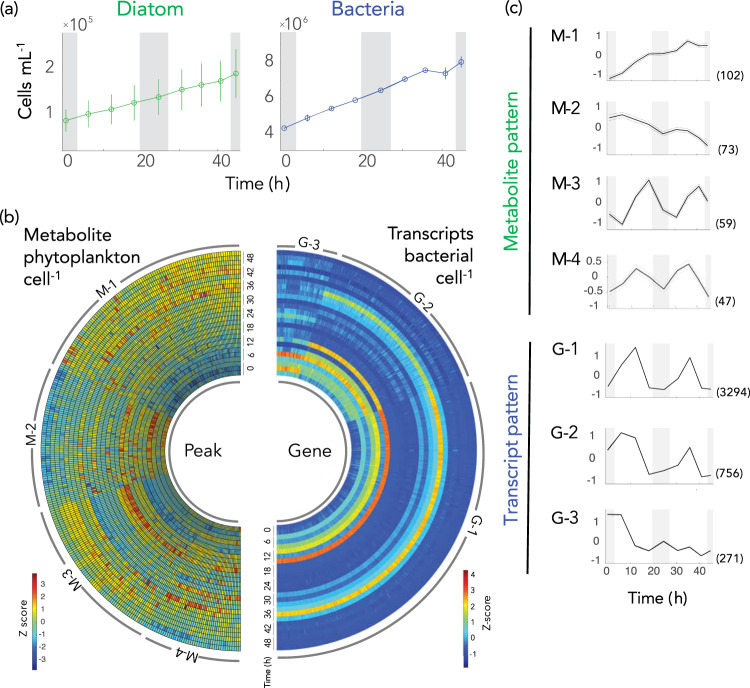
Fig. 1. Diel patterns in microbial cell numbers, phytoplankton metabolites, and bacterial transcripts.
a Cell numbers of co-cultured diatoms and bacteria. b Temporal variations in metabolite peak intensity per diatom cell (left) and transcripts per bacterial cell for genes differentially expressed between noon and night (>2 fold-change and adjusted-p < 0.05, DESeq2) (right). Values were converted to Z-scores and data from each of the three biological replicates are shown. c Temporal patterns identified for metabolites (M-1 through M-4) and gene transcription (G-1 through G-3). Dotted lines indicate 95% confidence intervals. The number of metabolite peaks or genes in each cluster is given in parentheses. Grey shading in panels (a) and (c) indicates night.

