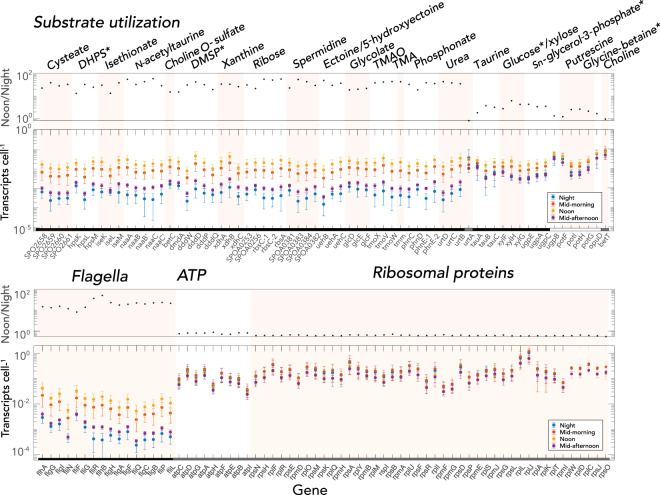
Fig. 2. Expression levels of representative R. pomeroyi genes encoding transporters or diagnostic catabolic genes (top) and, for comparison, genes encoding flagella, ATPases, and ribosomal proteins (bottom).
For each panel, the top plot shows noon to night ratios (black circles), and the bottom plot shows average transcripts cell-1 at night, mid-morning, noon, and mid-afternoon. n = 8 or 6; error bars indicate standard deviations. Categories of transcription temporal patterns (G-1, black; G-2, white, G-3, grey) are indicated along the x-axis. Asterisks indicate transporters whose target substrate matches an endometabolite identified with high confidence.

