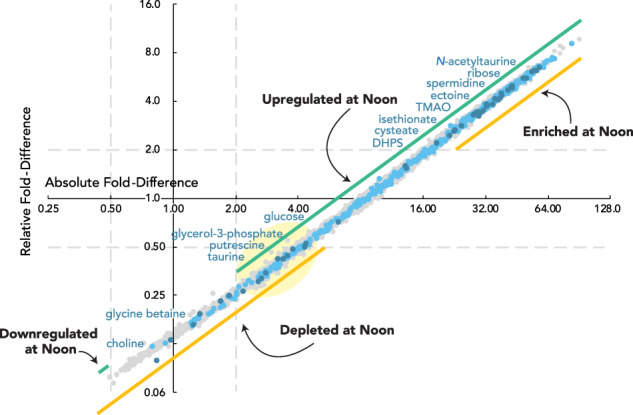
Fig. 3. Comparison of fold-difference values for absolute versus relative analysis of noon:night ratios of transcripts.

Absolute analysis (x-axis) represents up- or down-regulation of the number of transcripts per bacterial cell. Relative analysis (y-axis) represents enrichment or depletion as a proportion of the transcriptome. Dark blue symbols indicate the transporter genes in Fig. 2; light blue symbols indicate other transporter genes; grey symbols indicate the remaining R. pomeroyi genes. Dashed gray lines mark where fold-difference = 2 on each axis (log2 units). The light yellow oval highlights genes with per cell transcript inventories that are significantly higher at noon yet account for a significantly lower proportion of the cells’ transcriptome.
