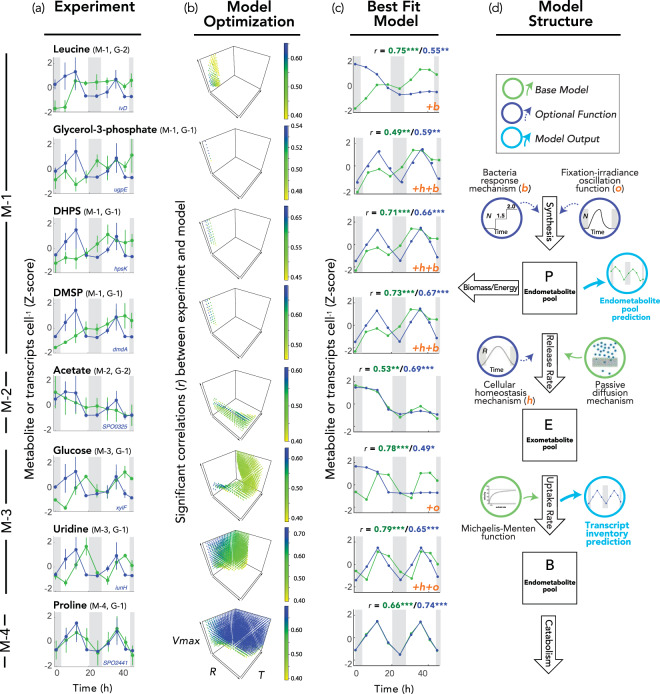
Fig. 4. Modeling diatom endometabolite pools and bacterial transcript inventories.
a Comparison of diel patterns for diatom endometabolite concentration (green symbols) and bacterial transcript inventory for a representative gene encoding uptake or catabolism of the same compound (blue symbols); additional relevant genes are shown in Fig. S6 (mean + standard deviation, n = 3 except for the first night where n = 2). b The base model was optimized with or without optional functions. Each point represents a parameter combination (out of 806,400 tested) for which the model output is significantly correlated with both metabolite and transcript experimental data, and points are colored according to the Pearson’s r values for correlations between experimental data and model simulations, averaged for transcript and metabolite datasets. c The best fit model based on average adjusted r, with individual r values given above the plots for metabolite (green font) and transcript (blue font) inventories. Functions added to the base model to achieve the best fit include two physiological balance mechanisms indicated as +o (irradiance-fixation oscillation) and +h (cellular homeostasis), and a bacterial recognition response indicated as +b. *p < 0.05; **p < 0.01; ***p < 0.001. d Simulation model structure.

