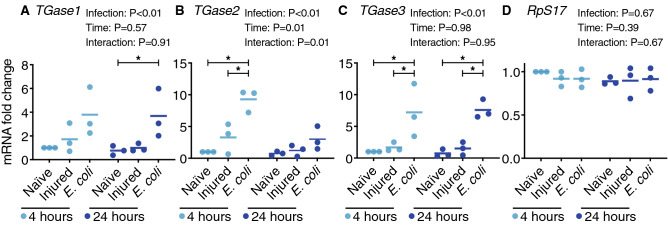
Figure 1.
Transglutaminase genes are transcriptionally upregulated following infection. Graphs show the relative mRNA level of TGase1 (A), TGase2 (B), TGase3 (C) and RpS17 (D; negative control; RpS17 data is shared with a concurrently conducted study16), in naïve (unmanipulated), injured and E. coli-infected mosquitoes at 4 or 24 h post-treatment. Each circle represents an independent biological trial, and the value is the average mRNA abundance relative to naïve mosquitoes at 4 h across 2–3 technical replicates within the trial. Data were analyzed by two-way ANOVA followed by Tukey’s post-hoc test. Infection P indicates whether infection has an effect irrespective of time, time P indicates whether time has an effect irrespective of infection, and interaction P indicates whether the effect of infection changes with time. The horizontal lines mark the means, and asterisks indicate post-hoc P < 0.05.

