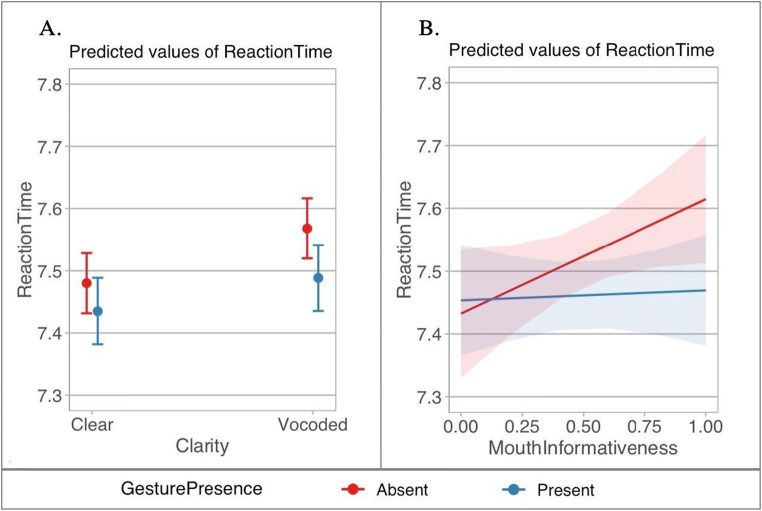
Fig. 3.
Predicted values of reaction times (log) for Analysis 1 (congruent gestures only). Plot a shows an interaction between speech clarity and gesture presence. Plot b depicts an interaction between mouth informativeness and gesture presence, with more informative mouth movements being closer to 0. Red color indicates gesture-absent, and blue indicates gesture-present conditions. Error bars represent confidence intervals (95%). (Colour figure online)

