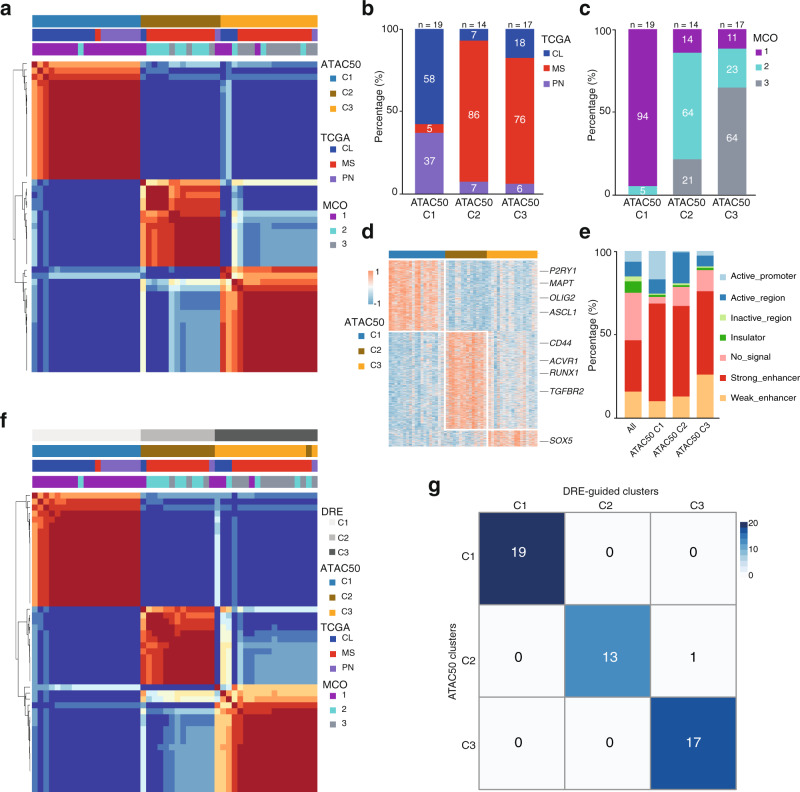
Fig. 3. Chromatin-accessibility robustly identifies three clusters of patient-derived GSC cultures.
a NMF cluster analysis of ATAC-seq data from 50 patient-derived GSC cultures. b Distribution of TCGA subtypes among ATAC50 clusters. c Distribution of MCO subgroups among ATAC50 clusters. d Heatmap of unique ATAC peaks of each ATAC50 cluster. Examples of genes annotated to the chromatin regions are indicated. e Genomic annotation of all ATAC peaks in the hGSC cohort and unique ATAC peaks of each ATAC50 cluster. f NMF cluster analysis of DRE ATAC peaks from 50 human GSC cultures. g Overlap of ATAC50 clusters with DRE-guided clusters. Source data are provided as a Source Data file for Fig. 3a–g.

