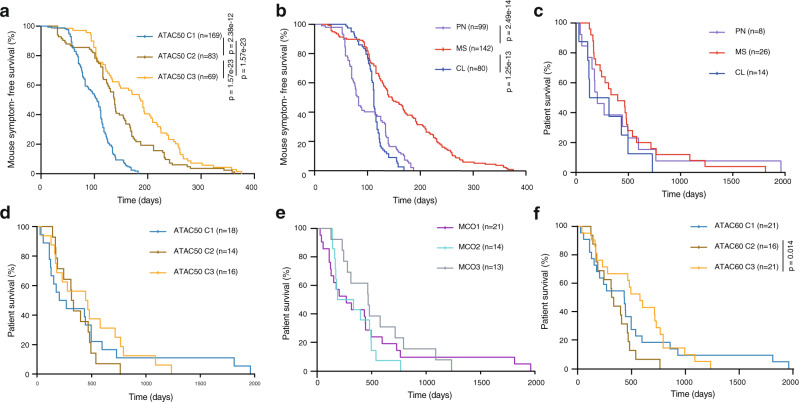
Fig. 6. Survival analyses comparing ATAC50, TCGA subtype, MCO, and ATAC60 classifications.
a, b Kaplan–Meier analysis of symptom-free survival of immune-deficient mice intracranially injected with 104, 105, or 2 × 10⁵ cells from 35 different hGSC cultures. n, number of injected mice. a Cultures are divided by ATAC50 clusters, C1 (n = 14), C2 (n = 11), C3 (n = 9). b Cultures are divided by TCGA subtypes, PN (n = 6), MS (n = 21), CL (n = 7). c–f Kaplan–Meier analysis of GBM patient survival. n, number of patients. c Patients are divided based on TCGA subtype. d Patients are divided based on ATAC50. e Patients are divided based on MCO. f Patients are divided based on ATAC60 clusters. C2 versus C3. Log-rank (Mantel–Cox) test was used and significant differences are indicated with p values. Source data are provided as a Source Data file for Fig. 6a–f.

