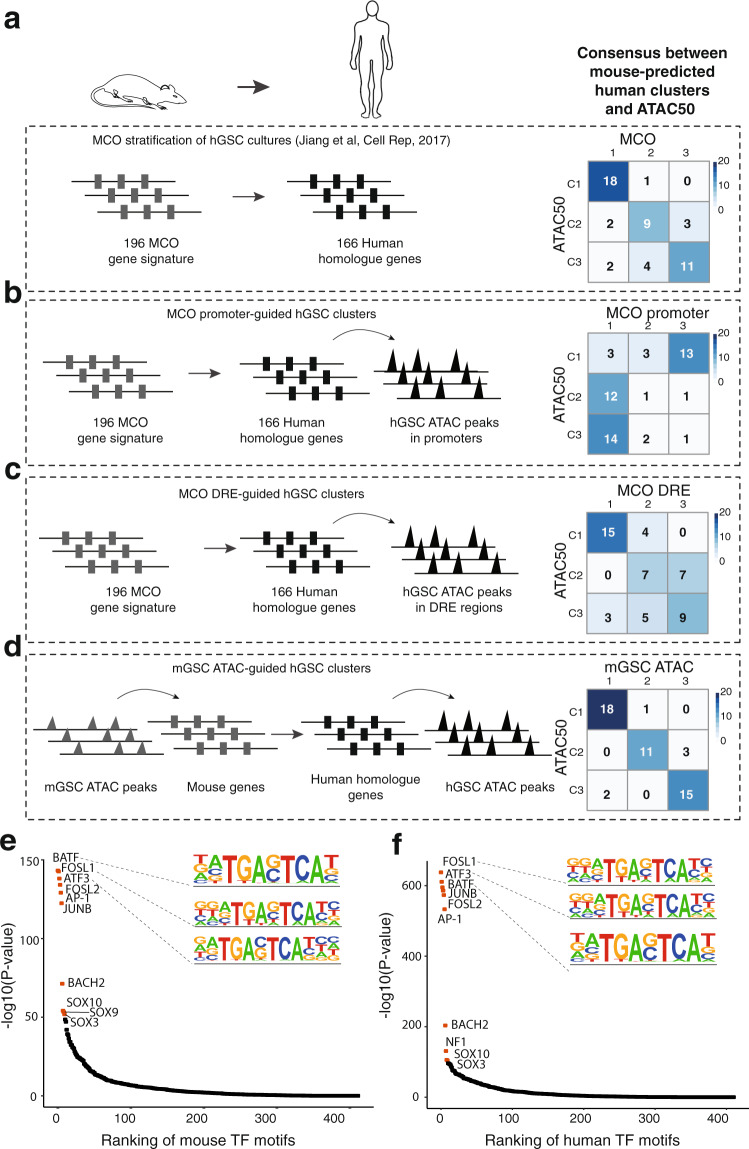
Fig. 7. Cross-species analysis reveal conservation between mouse and human GSC chromatin accessibility.
a–d Analyses of mouse GSC-guided clustering of hGSC cultures and their overlap with ATAC50 clusters. a Overlap with MCO gene expression classification22. Schematic figures were produced by the authors. b Overlap with clusters produced by hGSC ATAC data at MCO gene promoters. c Overlap with clusters produced by hGSC ATAC data at MCO DRE regions. d Overlap with clusters produced by converting mGSC cluster-unique ATAC data to hGSC ATAC data through peaks-to-genes and genes-to-peaks conversions. e Ranking of enriched TF motifs in mGSC cluster-specific ATAC peaks. Red circles indicate top-10 significant motifs. f Ranking of enriched TF motifs in the hGSC ATAC peaks obtained in (d). Red circles indicate top-10 significant motifs. Source data are provided as a Source Data file for Fig. 7a–f.

