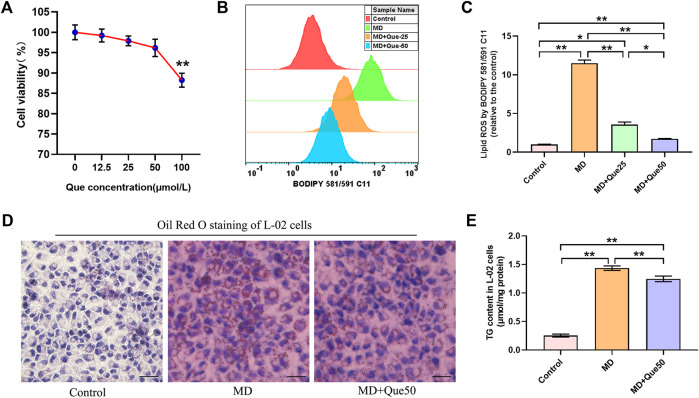
FIGURE 4.
Que reduced lipid ROS and lipid droplet accumulation in steatotic L-02 cells (n = 3). (A) The effect of Que treatment on L-02 cell viability. (B) Representative fluorescence intensity images of cellular lipid ROS by BODIPY 581/591 C11 obtained by flow cytometry. (C) Flow cytometric analysis of fluorescence intensity. (D) Oil Red O staining of L-02 cells (scale bar = 50 μm). (E) TG content in L-02 cells. The data are expressed as the mean ± SD from three independent experiments. **, p < 0.01 and *, p < 0.05.

