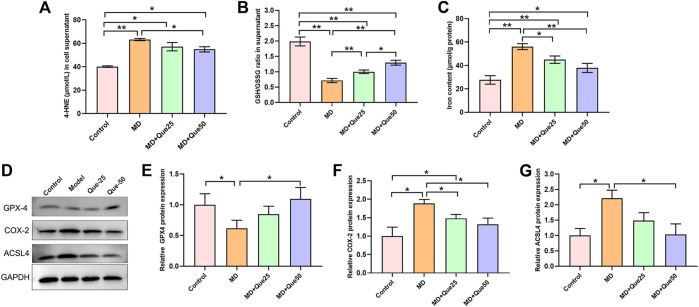
FIGURE 5.
Que suppressed lipid peroxidation and ferroptosis in steatotic L-02 cells. (A,B) The relative contents of 4-HNE and GSH/GSSG in L-02 cells (n = 3). (C) Iron content in cells (n = 3). (D) RepresentativeWestern blot images. (E–G) The expression of ferroptosis-related proteins (GPX4, COX-2 and ACSL4) in L-02 cells (n = 3). The data are expressed as the mean ± SD from three independent experiments. ∗∗p < 0.01 and ∗p < 0.05.

