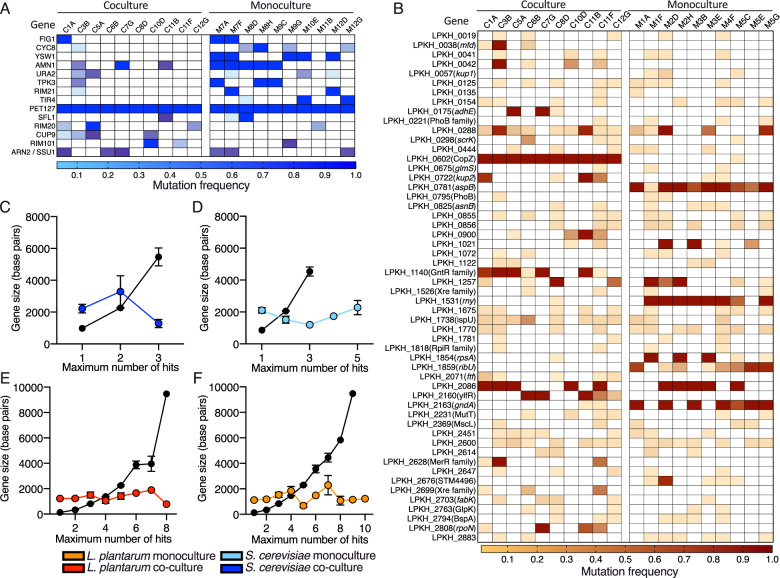
Fig. 3. The genetic targets of natural selection in monoculture and co-culture-evolved L. plantarum and S. cerevisiae.
The frequency of non-synonymous mutations (rows) in 10 co-culture-evolved and 10 monoculture-evolved populations (columns) of (A) S. cerevisiae and (B) L. plantarum. Populations were labelled with the well isolated from and prefixed with the treatment of either C for co-culture or M for monoculture. Genes with mutations in at least three replicate populations, with at least one of those mutations at a frequency > 0.2, are shown. In co-culture L. plantarum, one highly parallel genetic target, LPKH_0602(CopZ), contains the exact same mutation in all 10 co-culture populations, indicating that these mutations originated as standing genetic variation, rather than de novo mutations that evolved during the experiment. Keys below each graph indicate the frequency of each mutation; darker colouration corresponds to mutation at greater frequency. (C–F) The number of genes “hit” across replicate populations is compared with expectations under a null model of no natural selection (black line) that takes gene length into account since longer genes are more likely than shorter genes to be hit by mutation. The coloured lines and markers show the observed number of genes hit X times for (C) co-culture S. cerevisiae, (D) monoculture S. cerevisiae, (E) co-culture L. plantarum and (F) monoculture L. plantarum. Error bars displayed represent S.E.M.

