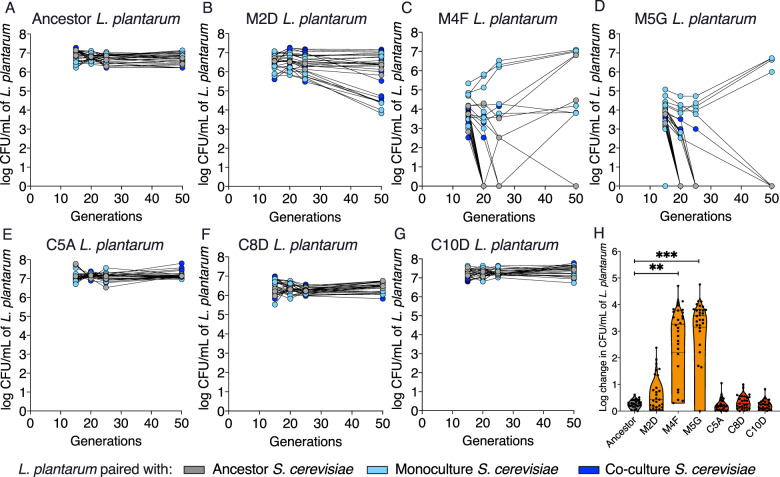
Fig. 4. The evolutionary loss coexistence in monoculture-evolved L. plantarum.
Colony forming units (CFU) per mL of (A) ancestral, (B–D) monoculture and (E–G) co-culture L. plantarum at 15, 20, 25 and 50 generations. All strains were co-cultured with the ancestor S. cerevisiae strain, three monoculture-evolved and three co-culture-evolved S. cerevisiae strains. Points represent all replicates of all pairings. L. plantarum strains are labelled with their experimental treatment and position in the microplate. For example, M2D is a monoculture-evolved L. planatarum population from microplate well 2D, and C5A is a co-culture-evolved L. plantarum population from microplate well 5A (one-way ANOVA, p < 0.0073 and p < 2 × 10⁻⁴, respectively, F = 6.78), with no significant change seen in co-cultured L. plantarum strains (one-way ANOVA, p > 0.99, F = 6.78). The carrying capacity (CFU) at generation 10 subtracted from generation 50 (H). Two monoculture L. plantarum populations - M4F and M5G - show a significant log change compared to the ancestral L. plantarum strain (one way ANOVA, p < 0.0073 and p < 0.0002 respectively, F = 6.775), with no significant change seen in co-cultured L. plantarum strains (one way ANOVA, p > 0.999, F = 6.775).

