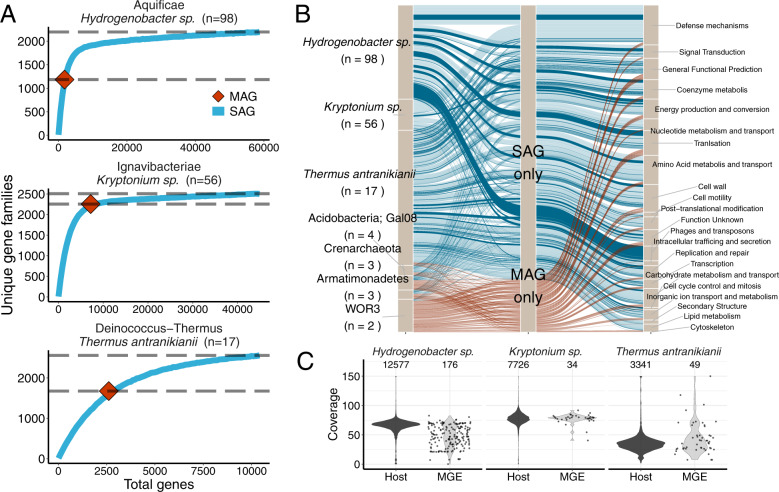
Fig. 3. The collection of within-species sets of SAGs indicated that MAGs lacked a proportion of the accessory component of the Dewar Creek population genomes.
A SAG rarefaction curves of the dominant lineages: Hydrogenobacter sp., Kryptonium sp., and Thermus antranikianii (blue lines) shown together with the total number of unique gene families within each corresponding MAG (red diamond). The difference between the two gray dotted lines indicates the number of unique gene families missed by the MAG. B Alluvial plots showing the gene families unique to SAGs and MAGs and their corresponding COG functional annotations (level 3) from all Dewar Creek lineages with paired SAGs and population MAG. The alluvial flows with darker coloring (SAG only subset) are those genes derived from contigs identified as MGEs. C Coverage of MGE genes within the bulk metagenome suggests variation in viral coverage as compared to the host genome. Coverage plots are based on read mapping of bulk metagenome reads to each of the SAG genomes. Note: Singletons from the unique gene family datasets have been removed from the SAG datasets in order to reduce the effect of potential contamination, i.e., the gene had to be observed in at least two SAGs.

