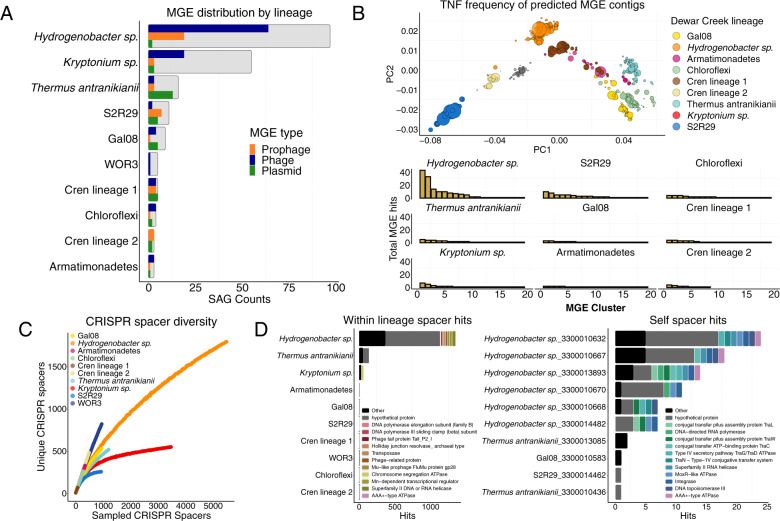
Fig. 4. MGE abundance, diversity, and subsequent spacer diversity within Dewar Creek SAGs.
A Presence/absence of each MGE type (phage, prophage, or plasmid) per SAG where the total number of analyzed SAGs are noted by the background, gray bar. Genomes considered positive for an MGE must have had at least 1 MGE contig greater than 10 kb. B MGE diversity. Tetranucleotide frequency of each MGE contig (excluding prophage as host genome cannot be excluded) (top). MGE counts per 99% ANI group (bottom) C Rarefaction curves noting spacer diversity within each lineage. D Spacer matches hitting another SAG within the same lineage excluding self hits (left), and self (within genome) hits (right).

