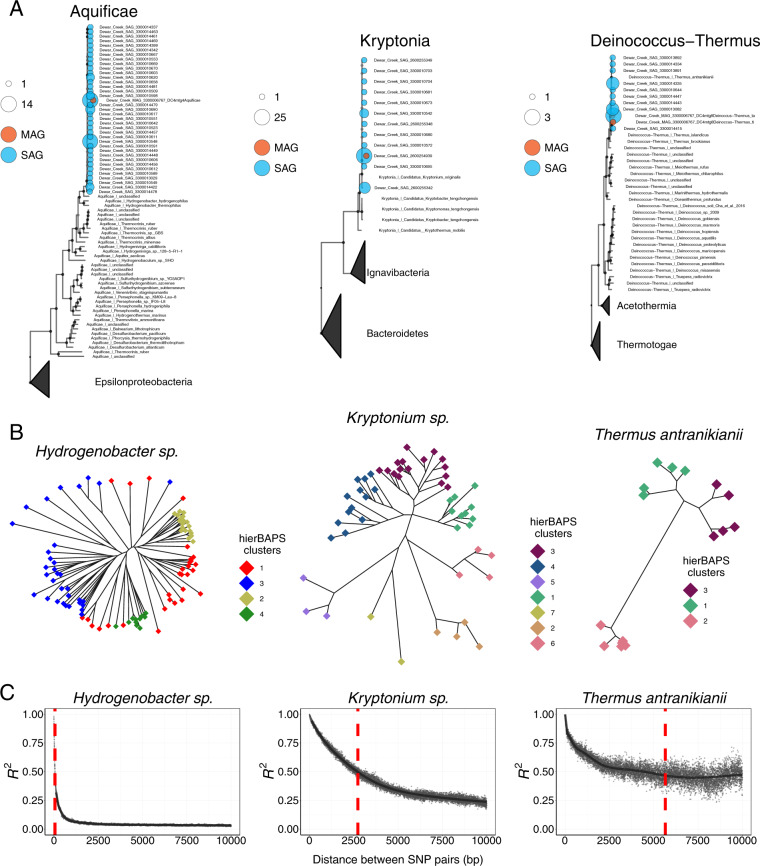
Fig. 5. Dominant Dewar Creek populations belonging to the Aquificae, Kryptonia, and Deinococcus-Thermus phyla.
A Lineage-specific conserved marker trees (same 56 markers used in above bacteria/archaea tree), where all available marker sequences were used for each phylum; sequences were depreplicated based on RNA Polymerase clustering at 100, 100, and 90% similarity for the Aquificae, Kryptonia, and Deinococcus-Thermus sequences, respectively. Dereplication was performed to remove redundancy and generate a representative set of marker sequences for each phylum. Dewar Creek genomes were also dereplicated, but at 100% RNA Polymerase identity where larger bubbles indicate an increase in the number of genomes for a given RNA Polymerase gene cluster. B SNP trees where variant positions were identified based on whole genome alignments. Tip colors correspond to hierBAPs Bayesian clustering results. A permanova analysis was performed to compare tree topologies with hierBAPs clustering, identifying inconsistences within Hydrogenobacter sp. (p < 0.05), but not Kryptonia sp. or Thermus antranikianii species (p > 0.05). C SNP linkage disequilibrium (LD) curves demonstrating evidence for more recent recombination within the Hydrogenobacter sp. The red dotted line represents the distance where the LD curve crosses an R2 threshold of 0.5, i.e., the distance in base pairs where 50% of the SNP pairs are no longer correlated. A smaller distance at an R2 of 0.5 indicates a higher rate of recombination.

