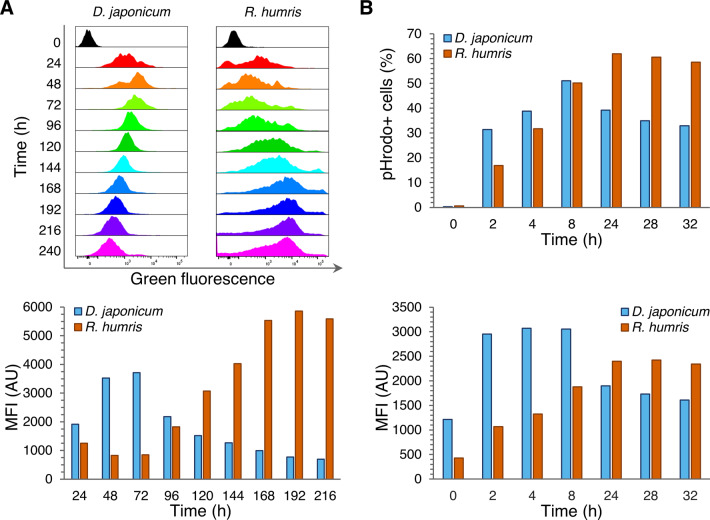
Fig. 2. Kinetics of consumption and digestion of bacteria.
A Time-course changes in green fluorescence signal emitted by FLB in food vacuoles of D. japonicum (blue) and R. humris (orange). Upper panel: each individual histogram represents the intensity of the green fluorescence (corresponding to the amount of ingested FLB) on the x-axis and the number of events on the y-axis. The composite of histograms shows the extent of changes in the relative fluorescence signal over time intervals of 24 h, which are color-coded. Lower panel: column chart showing comparison of mean fluorescence intensity (MFI) of both diplonemids. B Changes in abundance of D. japonicum (blue) and R. humris (orange) with ingested pHrodo Green dye-labeled bacteria over time and MFI emitted by these bacteria inside the food vacuoles of the respective diplonemids.

