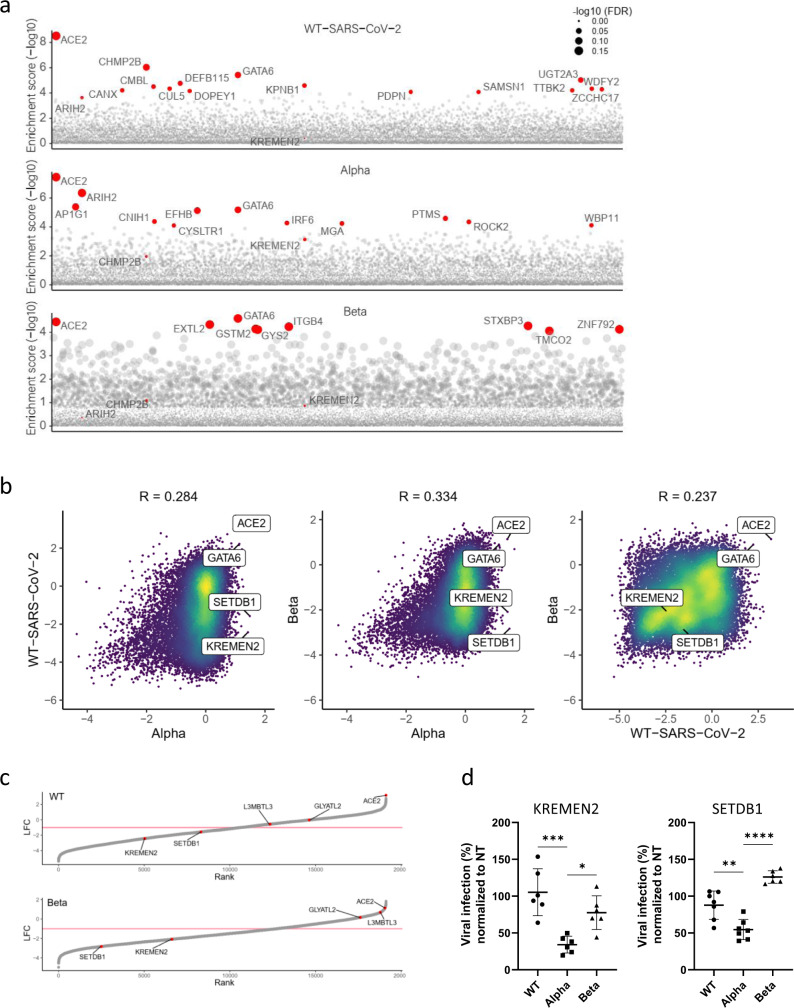
Fig. 3. Differential analysis of variants of SARS-CoV-2 screens highlights shared and specific host-factors dependencies.
a Gene enrichment score for CRISPR screens of WT-SARS-CoV-2, Alpha, and Beta variants infection. Enrichment scores were determined by MaGECK. b Scatter plot depicting gene enrichment in WT-SARS-CoV-2, Alpha, and Beta variants screens. R, Pearson correlation. c Rank plot showing the log fold-change (LFC) of genes in the WT-SARS-CoV-2 screen (top) or the Beta variant screen (bottom) and its rank according to their LFC (lowest LFC ranked 1). Each gene is shown as a gray point. The top five most enriched genes in the Alpha variant screen (based on fold-change) are labeled and shown in red. A pink line marks LFC of −1. d WT-SARS-CoV-2, Alpha and Beta VOCs levels in infected KREMEN2 and SETDB1 knockout Calu-3 cells. Cells were infected using MOI = 0.002 for 48 h. A non-targeting (NT) sgRNA was used as control. Data were analyzed from six biologically independent experiments by one-way ANOVA with two-sided Dunnett’s multiple comparisons test, comparing each experimental condition with Alpha variant. Shown are means ± SD. *p = 0.011; **p = 0.0012; ***p = 0.0002; ****p < 0.0001. Source data are provided as a Source Data file.

