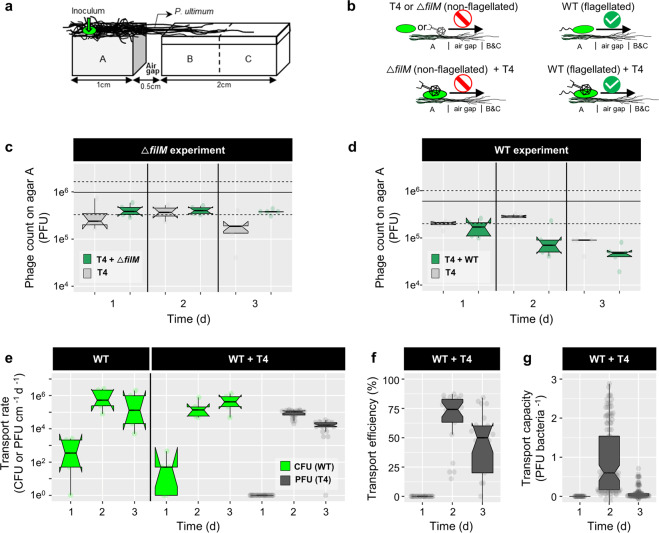
Fig. 2. Co-transport of T4 with P. putida KT2440 (WT or non-flagellated ΔfilM) along hyphae of P. ultimum.
a Scheme of the microcosm setup specifying microbial inoculation points and the spatial arrangement and dimensions of agar patches A, B, and C. b Experimental scenarios and observed results. Upper left panel: T4 or ΔfilM do not disperse along hyphae over the air-gap. Lower left panel: ΔfilM does not transport T4 along hyphae. Upper right panel: WT disperse along hyphae. Lower right panel: WT disperses along hyphae and transports T4 along hyphae over the air-gap. c, d T4 counts on agar patch A after 1 day in the absence and presence of ΔfilM (c) and WT (d). The solid and dashed lines indicate the median of 5 replicates and its 95CI of the initial inocula. e Time-dependent cumulative transport rates of WT (RWT, in green) and phages (RT4, in gray) to agar patches B and C (cf. Eq. 1). f Time-dependent phage transport efficiency in presence of WT (ET4). g Time-dependent phage transport capacity of WT (CT4). Data on T4 transport by ΔfilM are not shown as no transport was observed. Notches of the boxes represent 95CI of 5 replicates. If notches of two conditions do not overlap, it indicates a statistical difference between the two conditions.

