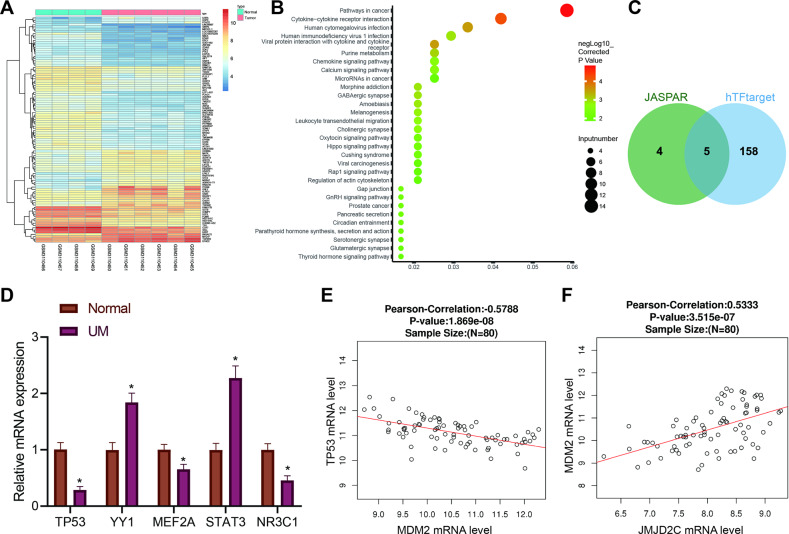
Fig. 1. Possible molecular targets involved in the occurrence and development of uveal melanoma are screened by bioinformatics analysis.
AThe heatmap for differential gene expression in GSE113625 uveal melanoma dataset. X-axis represents sample number, Y-axis represents gene name, left dendrogram represents gene expression clustering, each small block in the figure represents the expression of a gene in a sample, and the upper right histogram is color scale. B KEGG pathway enrichment analysis of differentially expressed genes. X-axis represents GeneRatio, the Y-axis represents KEGG entry, the circle color represents the corrected enrichment p value, the size represents the number of genes enriched in the entry, and the right histogram is the color scale. C IL5RA upstream transcription factor prediction. Two circles in the figure represent the prediction results of JASPAR database and hTFtarget database, and the middle part represents the intersection of the two groups of data. D The expression of TP53, YY1, MEF2A, STAT3, and NR3C1 in uveal melanoma (n = 32) and normal controls (n = 30) determined by RT-qPCR. * p < 0.05. E Correlation analysis between TP53 and MDM2 mRNA expression in the uveal melanoma samples from TCGA database. The abscissa represents the expression value of MDM2, the ordinate represents the expression value of p53, and the p value the correlation and the Pearson’s correlation coefficient are presented in the top. F Correlation analysis between JMJD2C (KMD4C) and MDM2 mRNA expression in the uveal melanoma samples from TCGA database. X-axis represents JMJD2C expression value, Y-axis represents MDM2 expression value, and the p value for the correlation and Pearson’s correlation coefficient are presented in the top.

