FIGURE 3.
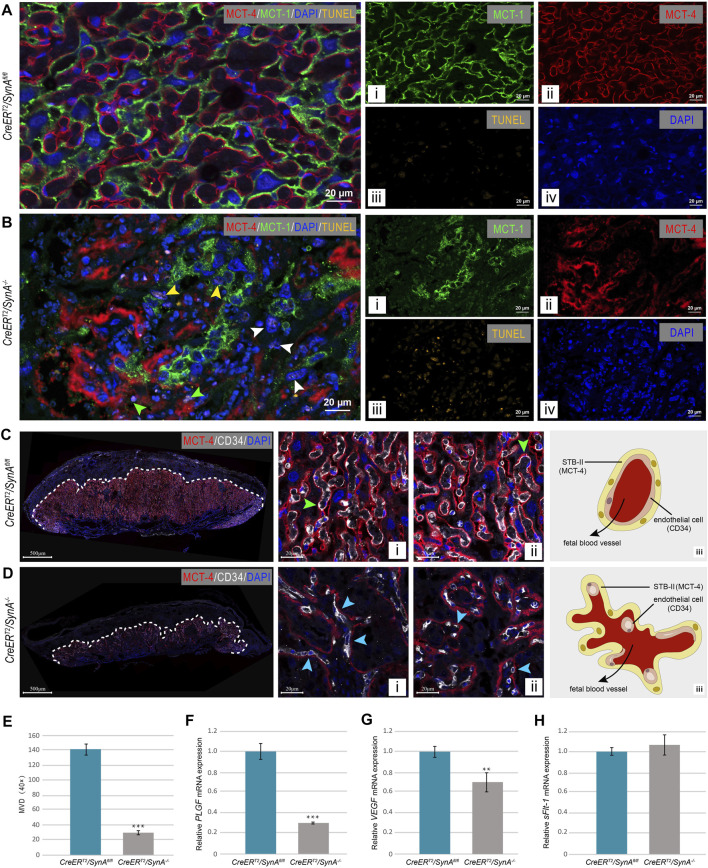
CreER T2 /SynA −/ − placenta exhibit cell apoptosis and vascular deficiency. (A,B) TUNEL staining of placental tissues at E 17.5 d. TUNEL positive cells were observed in CreER T2 /SynA −/− placentas compared to CreER T2 /SynA fl/fl placenta. (C,D) Anti-MCT4 and CD34 immunofluorescence staining of CreER T2 /SynA fl/fl and CreER T2 /SynA −/− placentas (E17.5 d). Fetal blood vessels are displayed with STB-II fully and tightly (green arrowheads) in the CreER T2 /SynA fl/fl placenta [(C)-i, -ii], but were lost in the normal structure and scattered with only a small surface attached to STB-II (blue arrowheads) in CreER T2 /SynA −/− placenta [(D)-i, -ii]. Distribution schematics of the endothelial cells are shown in (C)-iii and (D)-iii, and suggest a disruption of placental vascularization after disruption of Syncytin-A. (E) MVD of CreER T2 /SynA −/− placenta was decreased (E17.5 d). ***: p < 0.001. (F–H) Relative mRNA expression levels of PLGF, VEGF and sFlt-1 of CreER T2 /SynA fl/fl and CreER T2 /SynA −/− placentas (E17.5 d). **: p < 0.01, ***: p < 0.001.

