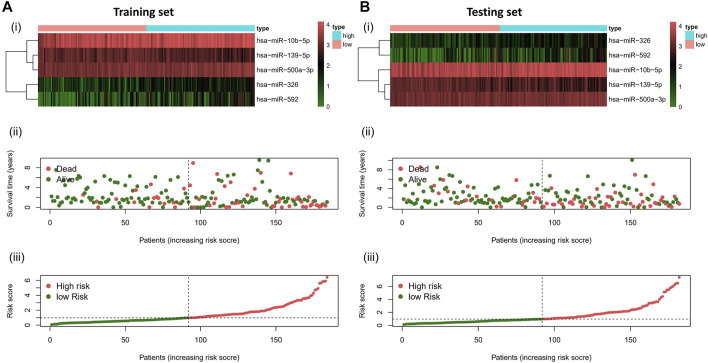
FIGURE 4.
Risk distribution of all patients. (A)Training sets [(A), i] Heatmap of different risk groups in 5-specific necroptosis-related miRNAs. [(A), ii] Risk score scatter plot. [(A), iii] Risk score curve plot. (B) Testing sets [(B), i] Heatmap of different risk group in 5-specific necroptosis-related miRNAs. [(B), ii] Risk score scatter plot. [(A), iii] Risk score curve plot. Patients are categorized into low-risk (green) and high-risk (red) groups.

