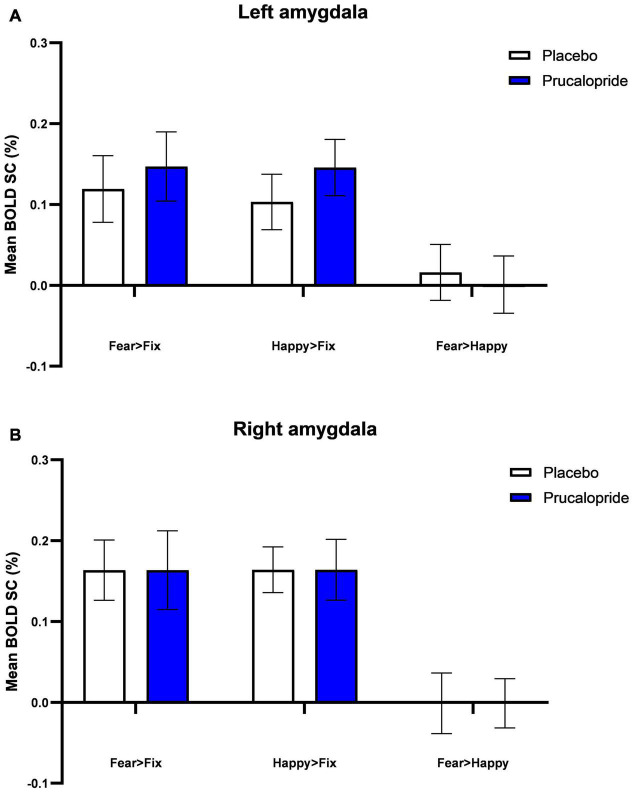
FIGURE 3.
Blood-oxygenation-level-dependent percentage signal change (SC) extracted from left amygdala (A) and right amygdala (B). Group mean of BOLD percentage signal change extracted from L amygdala (A) and R amygdala (B) in response to fearful and happy images (fear > fixation; happy > fixation; fear > happy). Error bars show standard error of the mean. The anatomical mask used was the Harvard-Oxford atlas at 90% threshold.

