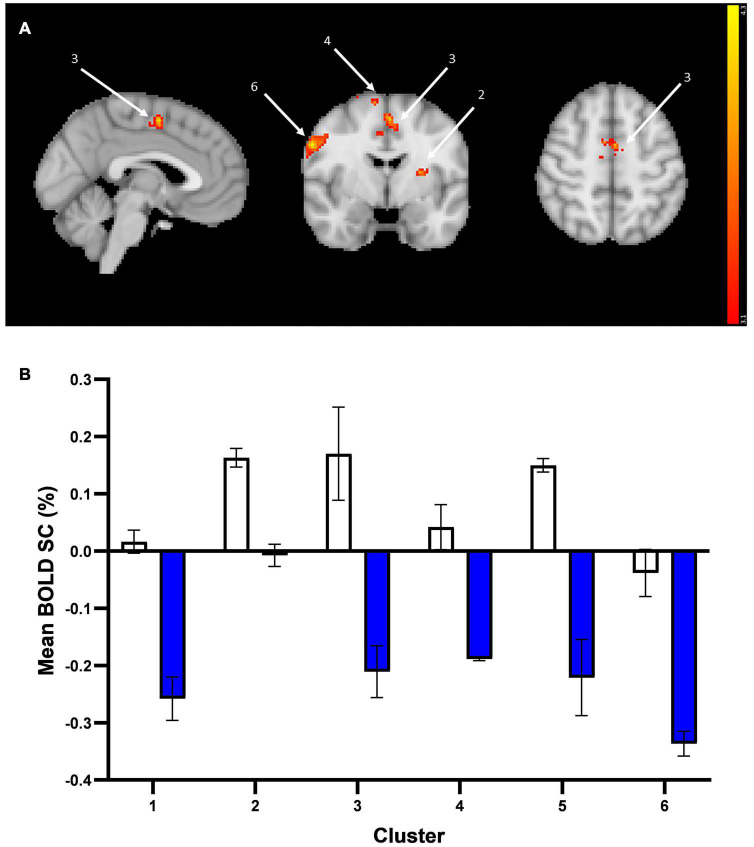
FIGURE 4.
Whole brain fMRI Faces Task results. (A) Whole-brain activation in response to mean effect of task (mean > fixation) in placebo vs. prucalopride group. Sagittal, coronal, and axial images (shown at MNI location 45,61,62) depicting significantly increased activation in the placebo group for the mean contrast in significant clusters (Clusters: 1 = L post-central/pre-central gyrus; 2 = L putamen/insula; 3 = anterior cingulate cortex; 4 = R superior frontal gyrus; 5 = L supramarginal/post-central gyrus; 6 = R pre-central/post-central gyrus); cluster 1 and 5 not visible in figure. Images thresholded at z > 3.1 p < 0.05 corrected. Red to yellow colours identify increases in brain activation (scale Z = 3.1–4.3). (B) Group mean of BOLD percentage signal change (SC) extracted from the 6 clusters (mean > fixation). Error bars show standard error of the mean. White = placebo; blue = prucalopride. Clusters: 1 = L post-central/pre-central gyrus; 2 = L putamen/insula; 3 = anterior cingulate cortex; 4 = R superior frontal gyrus; 5 = L supramarginal/post-central gyrus; 6 = R pre-central/post-central gyrus.

