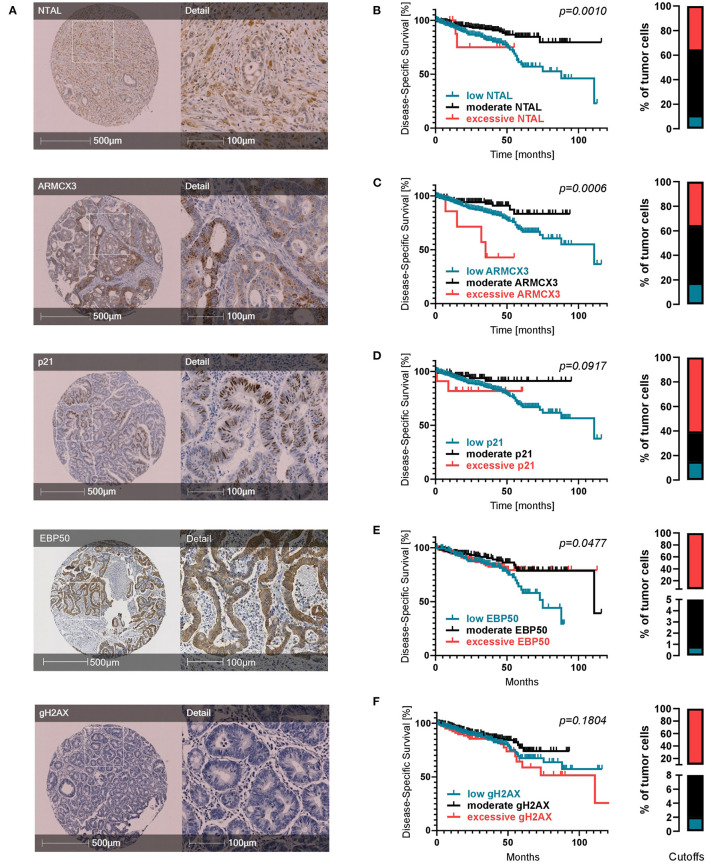
Figure 2.
Expression of senescence-associated molecules in CRC patients. (A) Representative TMA cores for each IHC marker. (B–F) Kaplan-Meier survival analyses regarding expression of senescence markers when divided into three subcohorts: low expression (petrol), moderate expression (black) and excessive expression (red). Cutoffs are displayed as bar graphs on the right of each curve and were calculated using a modification of the Charité Cutoff Finder from (54). Disease-specific survival is shown. Two tier subdivision, progression-free survival and detailed individual cutoff values can be found in the Supplementary Material.

