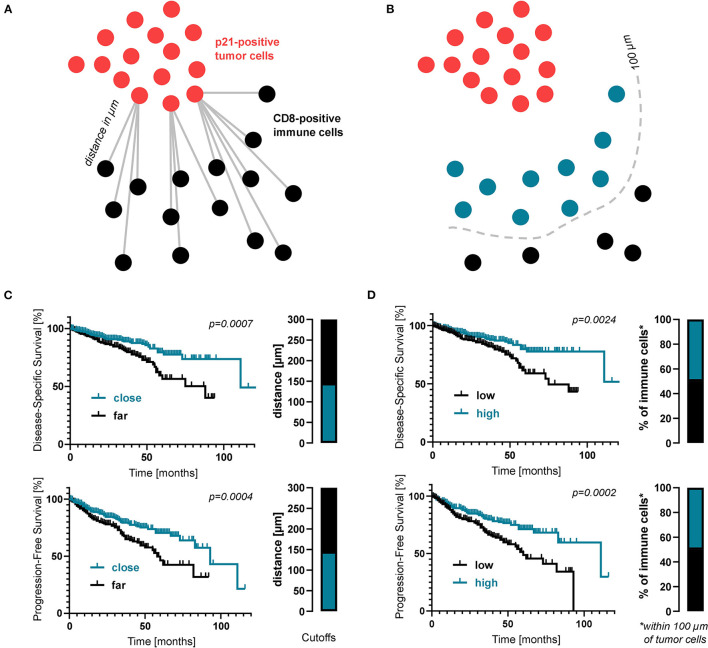
Figure 3.
Proximity analysis of senescent cells and immune cells in CRC patients. (A) Schematic drawing of how the distance between immune cells and senescent tumor cells was measured. (B) Kaplan-Meier survival analyses regarding the average distance between CD8- and p21-positive cells. (C) Schematic drawing of how the proportion of immune cells within close proximity (within 100 μm) of senescent tumor cells was measured. (D) Kaplan-Meier survival analyses regarding the percentage of CD8-positive cells within 100 μm of p21-positive cells. Again, cutoff values are displayed as bar graphs.

