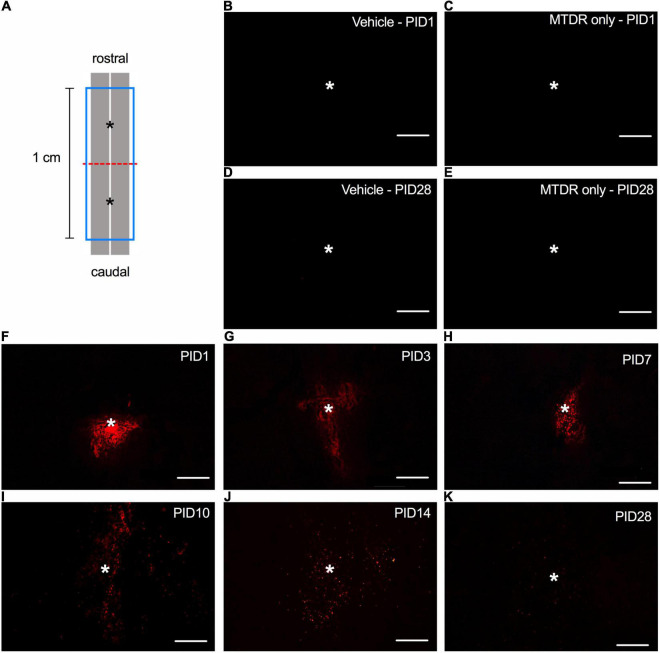
FIGURE 1.
The spatiotemporal distribution of transplanted mitochondria in the injured spinal cord of rats with traumatic SCI. (A) Diagram of the schematic spinal cord. The red dash line indicated the injury site. The blue frame indicated the 1-cm sampling area. The asterisks denoted the sites of administration of allogeneic mitochondria. (B) Representative micrograph of MTDR signals in the injured spinal cord of rat injected with 1x PBS vehicle on PID 1. (C) Representative micrograph of MTDR signals in the injured spinal cord of rat injected with MTDR dye on PID 1. (D) Representative micrograph of MTDR signals in the injured spinal cord of rat injected with 1x PBS vehicle on PID 28. (E) Representative micrograph of MTDR signals in the injured spinal cord of rat injected with MTDR dye on PID 28. (F–K) Representative micrograph of MTDR signals which were detected on PID1, 3, 7, 10, 14, and 28 in the injured spinal cord of rats injected with MTDR-labeled mitochondria. Horizontal sections were used. Scale bar = 100 μm. N = 1 rat per panel. The asterisks indicate the points of injection.

