
Figure 2.
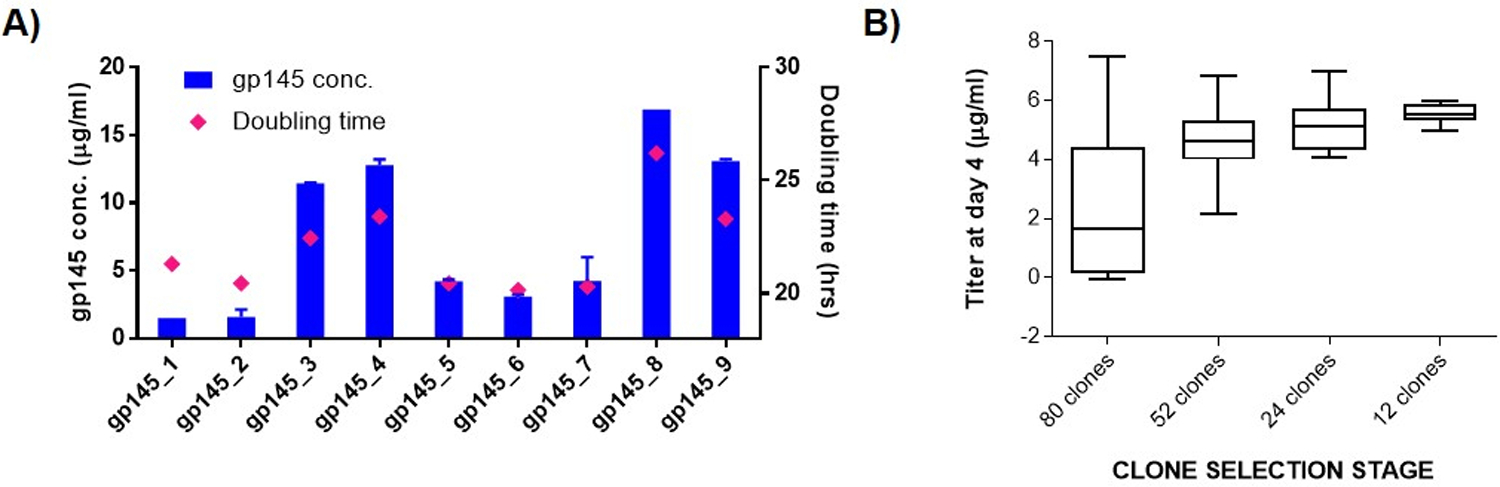
Pool generation and subcloning and clone selection for gp145. (A) Productivity and growth characteristics of STEP™-generated pools for gp145 a 7-day shaking batch overgrow culture. Day 5 titers and average doubling time are depicted as blue bars and magenta diamonds, respectively. (B) Subcloning, starting from pool gp145_9, and clone selection for gp145. The box-and-whiskers plot shows the outcome of the selection steps leading up to selection of the top 12 clones. At each stage, clones with the highest volumetric productivities and better growth characteristics were selected. The box represents the 25th and 75th percentile w.r.t. ELISA titers and whiskers are drawn at the minimum and maximum values of each set.