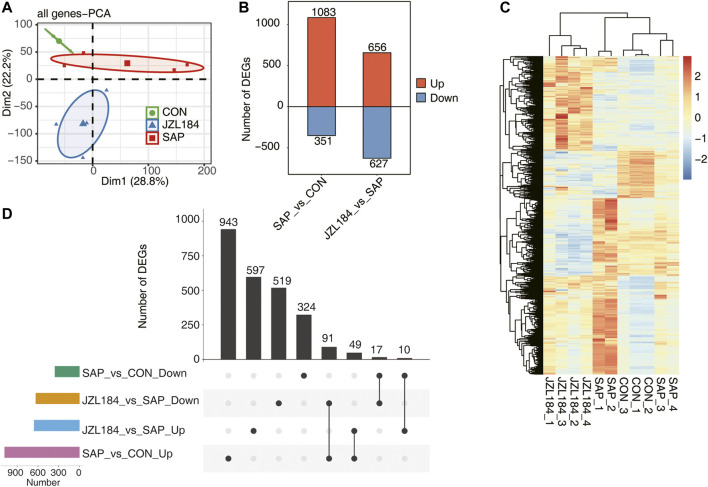
FIGURE 2.
MAGL inhibitor broadly affect the gene expression profile of intestinal tissue of rats with SAP. (A) PCA base on FPKM value of all detected genes. The ellipse for each group is the confidence ellipse. The confidence ellipsis of the three groups did not overlap and the samples were obviously separated; (B) Bar plot showing the result of up-regulated and downregulated genes in the group comparisons. DEG analysis showed that 1,434 genes were differentially expressed between SAP and control groups; (C) Hierarchical clustering heat map showing expression levels of all DEGs. The expression of DEGs in SAP group showed slight differences due to individual responses to experimental treatments; (D) Overlap analysis plots of DEGs genes in each group. A total of 91 DEGs were downregulated in the JZL184 group compared with the SAP group, but were upregulated in the SAP group compared with the control group. n = 3 in control group. n = 4 in SAP group and JZL184 group.

