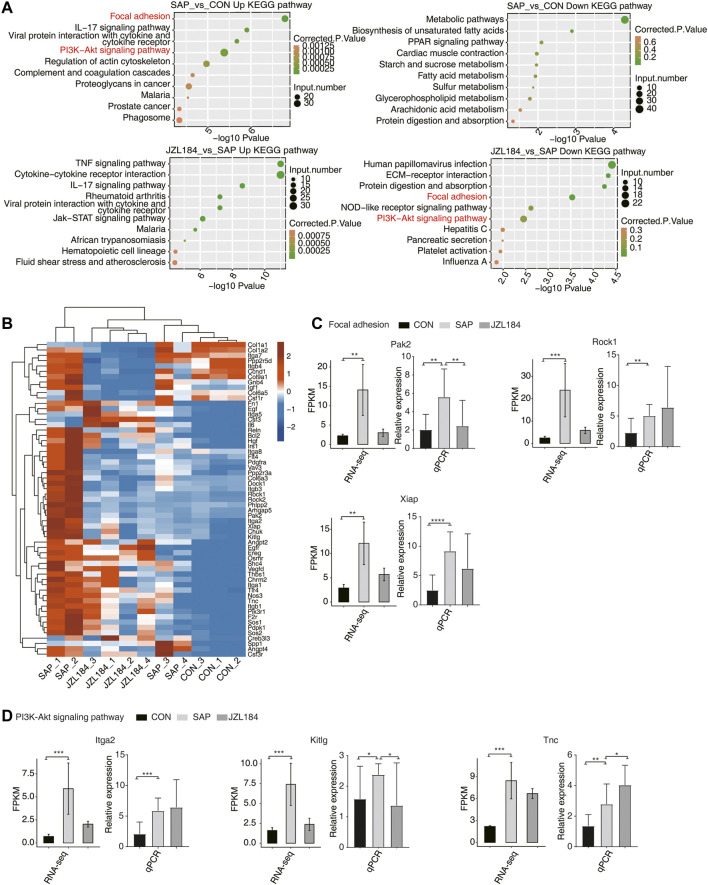
FIGURE 3.
MAGL inhibitor extensively change alternative splicing pattern of genes in intestinal tissue of rats with SAP. (A) Bubble plot showing the top ten enriched KEGG terms for up regulated (Left panel) and down regulated (Right panel) DEGs. The downregulated genes in the SAP group were mainly enriched in human papillomavirus infection, ECM receptor interaction, protein digestion and absorption, focal adhesion, nod-like receptor signaling pathway, PI3K-Akt signaling pathway, hepatitis C, pancreatic secretion, platelet activation, and influenza (A,B). Hierarchical clustering heat map showing the expression levels of all genes on Focal adhesion and PI3 K-Akt signaling pathway in Top 10 in the KEGG analysis. The expression of Rock1, Rock2, Pak2, Xiap, Arhgap5, Itga2, Tnc, Dock1, Col6a3, Pdgfra, Chuk, Kitlg, Sos1, Ppp2r3a, and Phlpp2 was higher in the SAP group and lower in the JZL184 group; (C) Bar plot showing the expression pattern and statistical difference of DEGs for some important genes in Focal adhesion. Error bars represent mean ± SEM. The expression of Pak2, Rock1, and Xiap was increased in the SAP group compared with the control group, which was consistent with our expectations. Moreover, expression of Pak2 and Xiap was decreased in the JZL184 group compared with the SAP group; ***p-value < 0.001, **p-value < 0.01. (D) Bar plot showing the expression pattern and statistical difference of DEGs for some important genes in PI3K-Akt signaling pathway. Error bars represent mean ± SEM. The expression of Itga2, Kitlg, and Tnc was increased in the SAP group and that of Kitlg was decreased compared with the control group, whereas Itga2 and Tnc gene expression was increased in the JZL184 group compared with the SAP group. *** p-value < 0.001, ** p-value < 0.01. n = 3 in control group. n = 4 in SAP group and JZL184 group.

