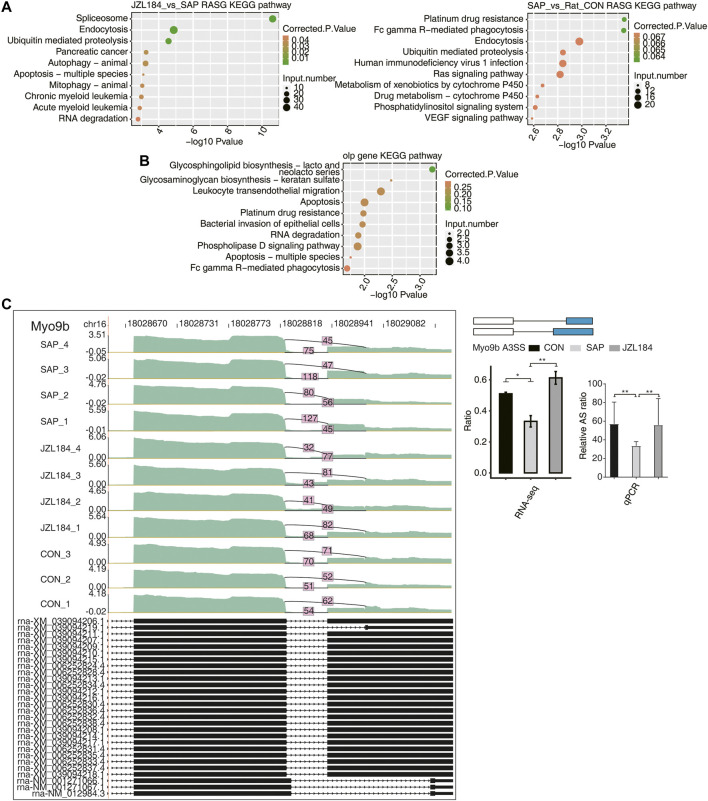
FIGURE 5.
Function analysis of MAGL inhibitor regulated alternative genes in intestinal tissue of rats with SAP. (A) Bubble plot showing enriched KEGG analysis plots of RASE. The differential ASEs were mainly enriched in platinum resistance, FC-γR-mediated phagocytosis, endocytosis, ubiquitin-mediated proteolysis, human immunodeficiency virus 1 infection, Ras signaling pathway, cytochrome P450 metabolism of exogenous drugs, drug metabolism cytochrome P450, phosphatidylinositol signaling system, and the VEGF signaling pathway between the SAP and control groups; AS genes were mainly enriched in splicing, endocytosis, ubiquitin-mediated proteolysis, pancreatic cancer, animal autophagy, apoptosis of many species, animal mitochondrial autophagy, chronic myelogenous leukemia, acute myeloid leukemia, RNA degradation, and other functional pathways between the JZL184 and SAP groups; (B) Bubble plot showing enriched KEGG analysis of the genes with overlapped shear events in the opposite direction obtained by the two comparison groups; (C) MAGL regulates alternative splicing of Myo9b. Left panel: IGV-sashimi plot showing the regulated alternative splicing events and binding sites across mRNA. Reads distribution of RASE is plotted in the up panel and the transcripts of each gene are shown below. Right panel: The schematic diagrams depict the structures of ASEs. RNA-seq validation of ASEs are shown at the bottom of the right panel. Error bars represent mean ± SEM. *** p-value < 0.001, ** p-value < 0.01, * p-value < 0.05. n = 3 in control group. n = 4 in SAP group and JZL184 group.

