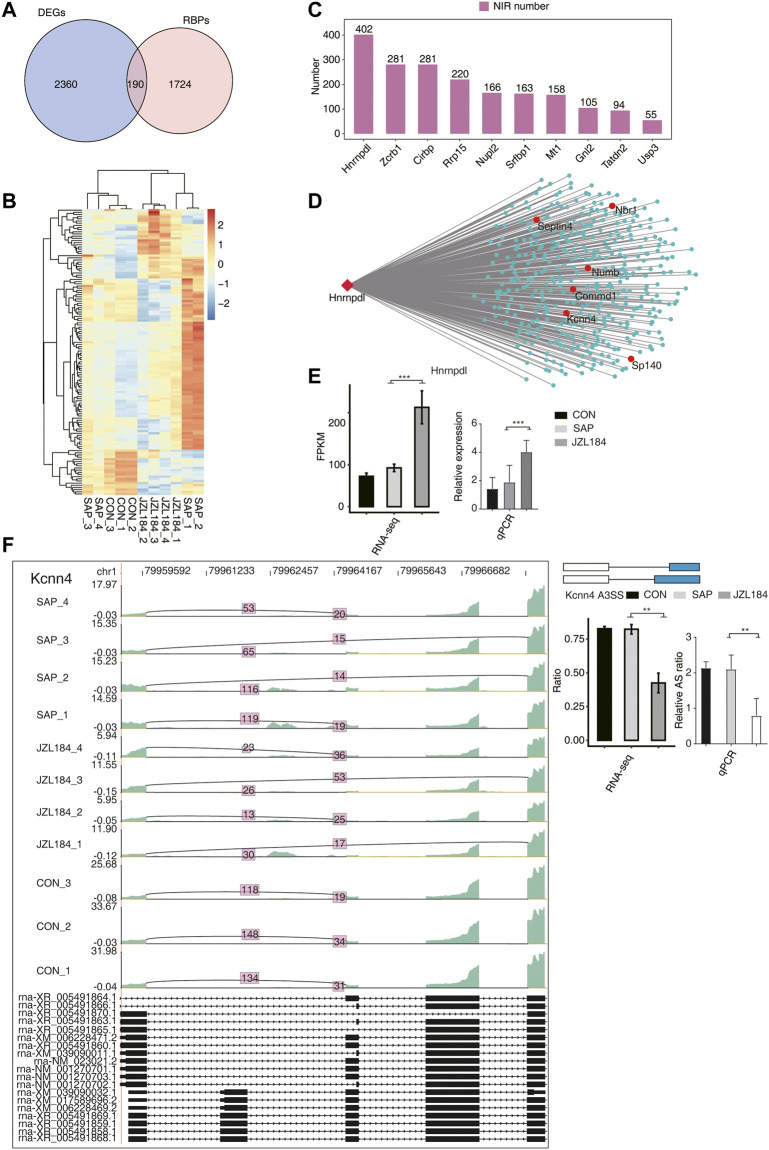
FIGURE 6.
Co-expression analysis between MAGL inhibitor regulated RBPs with NIR in intestinal tissue of rats with SAP. (A) Venn diagram showing the overlapped genes between RBPs and DEGs; (B) Hierarchical clustering heat map showing the expression levels of the overlapped genes in (A). Significant differences in the expression levels of these RBPs were found among the groups (Show expression FPKM greater than 1 in 80% of the samples); (C) Bar plot showing the number of NIR expressed showing the top10 RBPs sorted by the number of RBPs co-expressed from the above screened RBPs; (D) Co-expression network between NIRs and Hnrnpdl gene. These RBPs were specifically and highly expressed in the JZL184 group, in which the ASEs co-expressed by HNRNPDL comprised the most, which reached 402 ASEs; (E) Bar plot showing the expression pattern and statistical difference of DEGs for Hnrnpdl gene. Error bars represent mean ± SEM; ***p-value < 0.001. (F) MAGL regulates alternative splicing of Kcnn4. Left panel: IGV-sashimi plot showing the regulated alternative splicing events and binding sites across mRNA. Reads distribution of RASE is plotted in the up panel and the transcripts of each gene are shown below. Right panel: The schematic diagrams depict the structures of ASEs. RNA-seq validation of ASEs are shown at the bottom of the right panel. Error bars represent mean ± SEM. *** p-value < 0.001, ** p-value < 0.01, * p-value < 0.05. n = 3 in control group. n = 4 in SAP group and JZL184 group.

