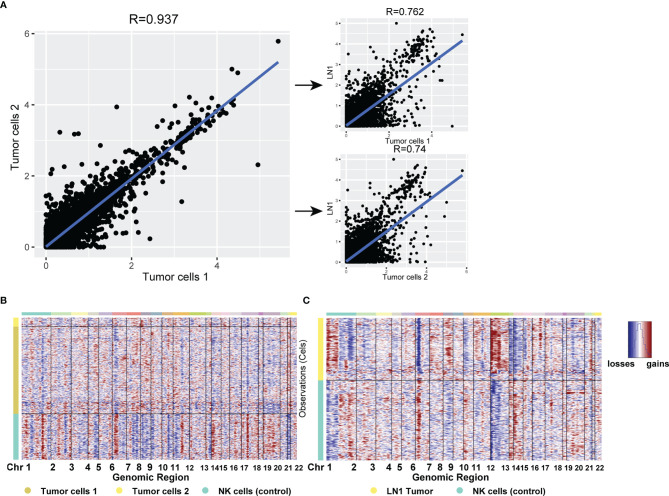
Figure 6.
(A) Scatterplot showing the log1p of the average expression (AE) per gene in different tumor cell types from primary testicular tumor and pelvic lymph node metastasis. (B, C) CNV analysis for all cell types in testicular tumor (B) and pelvic lymph node metastasis (C). Copy number gains (red) and losses (blue).

