Figure 7.
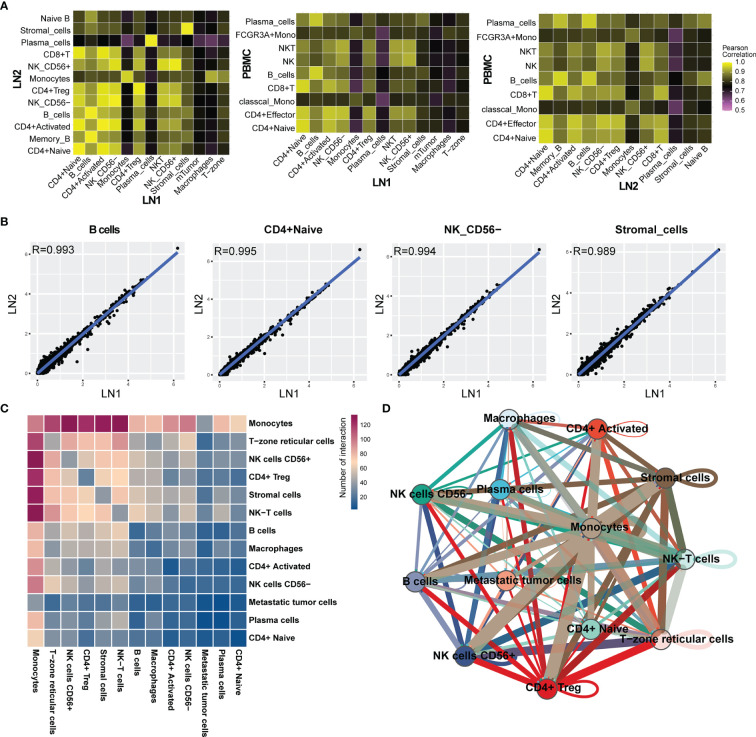
(A) Heat map indicating Pearson correlations on the averaged profiles among each cell types for left pelvic lymph node (LN1) and left renal hilus lymph node (LN2) and PBMC. (B) Scatterplot showing the log1p of the average expression per gene of B cells, CD4+ naive T cells, CD56- NK cells and stromal cells in LN1. (C) Ligand–receptor interactions across each cell type in LN1; the colour represents the number of interactions. (D) Analysis of cell-cell communication of each cell type by Cell chat. Nodes represent the cluster, and the line thickness represents number of interactions.

