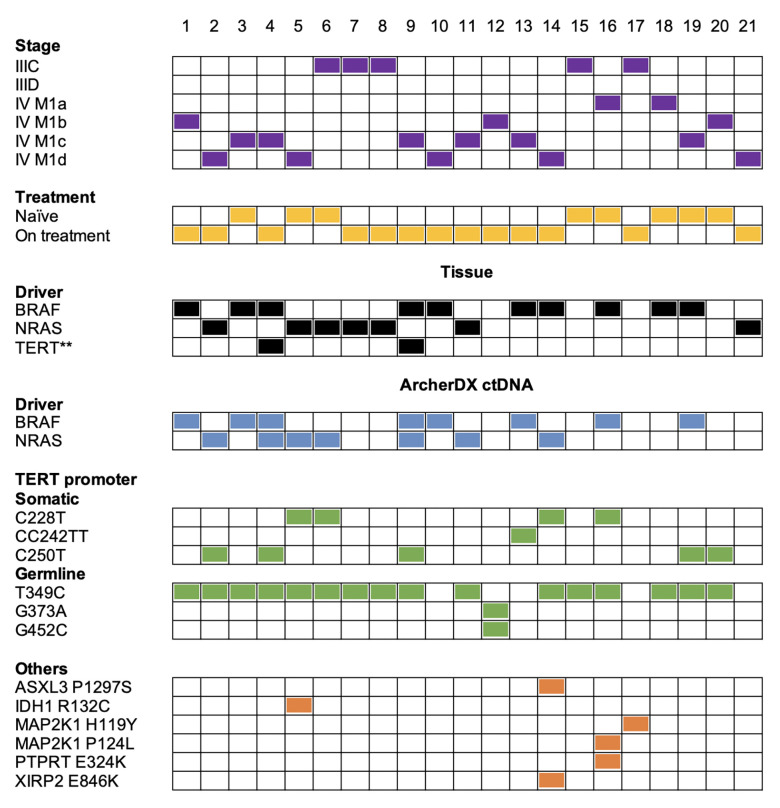
Figure 2.
Summary of the melanoma mutation profile identified across the 21 melanoma patient samples from a cohort of 19 melanoma patients. Comparison of melanoma stage (purple boxes), treatment (yellow boxes), tissue driver mutations (black boxes) versus mutations detected with the ArcherDX custom melanoma ctDNA panel including driver mutations (blue boxes), TERT promoter somatic mutations or germline variations (green boxes) and other cancer-associated mutations (orange boxes). Numbers represent sample number. For further details on specific gene variations identified and patient details refer to Table S2 . Samples 4 and 9 are derived from a single patient at two time points. Samples 7 and 8 are derived from a single patient at two time points. **Mutation data from a cell line derived from patient tissue collected 12 months after liquid biopsy samples.

