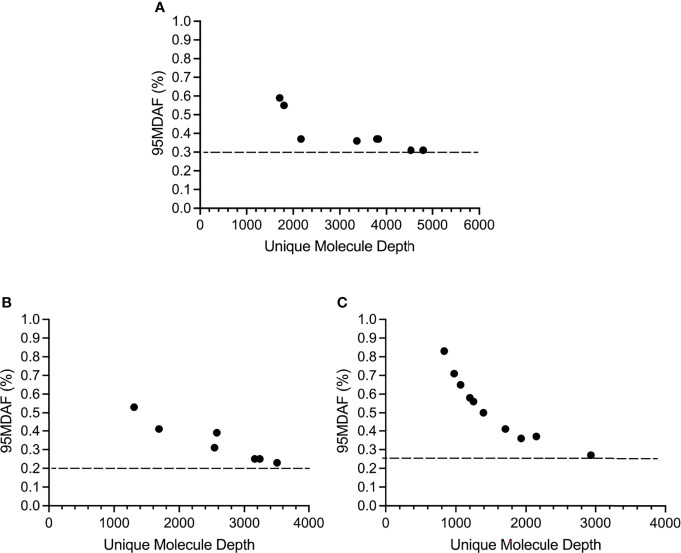
Figure 3.
Sensitivity of the custom melanoma ctDNA panel based on BRAF, NRAS or TERT promoter mutations identified across the melanoma cohort. Each circle corresponds to the 95 minimal detectable allele fraction (95MDAF) values and unique molecule depth (unique fragments covering the specified region) for a single sample. (A) BRAF V600 mutations. Data derived from samples 1, 3, 4, 9, 10, 13, 16, 19. (B) NRAS G60/Q61 mutations. Data derived from samples 2, 4, 5, 6, 9, 11, 14. (C) TERT 228-250 promoter mutations. Data derived from samples 2, 4, 5, 6, 9, 13, 14, 16, 19, 20.

