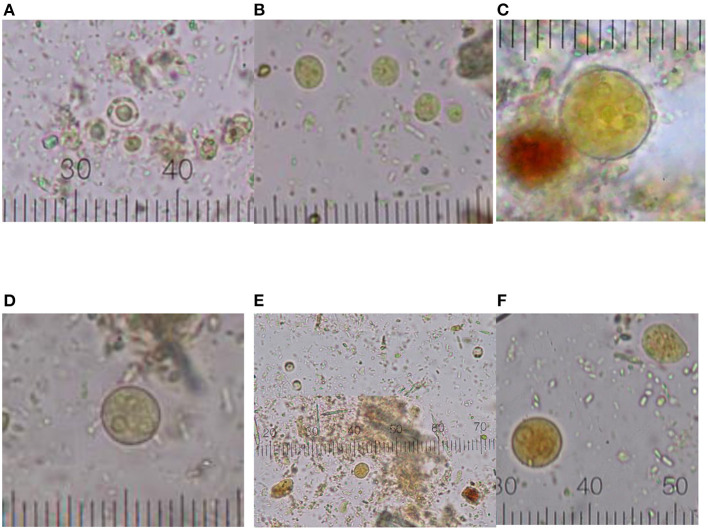
Figure 1.
Graphical distribution of intestinal protozoa cysts. (A) Blastocystis sp.; (B) End. nana; (C) Ent. coli; (D) Ent. hystolytica/dispar; (E) coinfection (Blastocystis sp. and End. nana); (F) coinfection multiple (Ent. hystolytica/dispar, End. nana, Blastocystis sp.). Micrometric coefficient: 2.5 μm (A,C–F); 1 μm (B).

