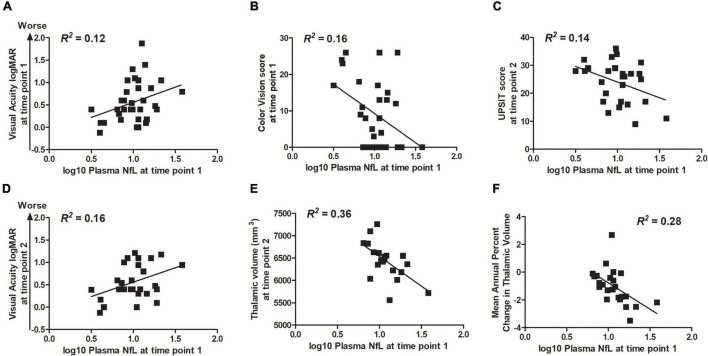
FIGURE 3.
Within the Wolfram group, higher log10 plasma NfL levels at time point 1 related to (A,B) worse visual acuity and color vision at time point 1; (C–E) worse visual acuity and color vision (data not shown), less accurate smell identification, and smaller thalamic volume at time point 2; and (F) faster rate of annual decrease in thalamic volume.

