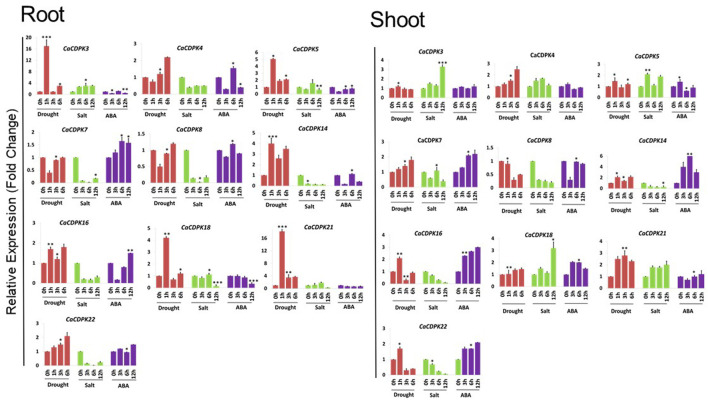
Figure 9.
Expression profiles of CDPK genes under drought, salt, and ABA treatments in chickpea. qRT-PCR analysis was performed to generate the expression profile of CaCDPK genes under drought, salt, and ABA treatment in root and shoot of desi chickpea (ICC4958). Different treatments and time points are indicated on X-axis and the relative expression level of the gene is indicated on Y-axis. Each bar represents the mean value of three replicates. Standard error among the samples is indicated by error bars. *p < 0.05, **p < 0.01 and ***p < 0.005 for treated samples w.r.t. untreated control.

