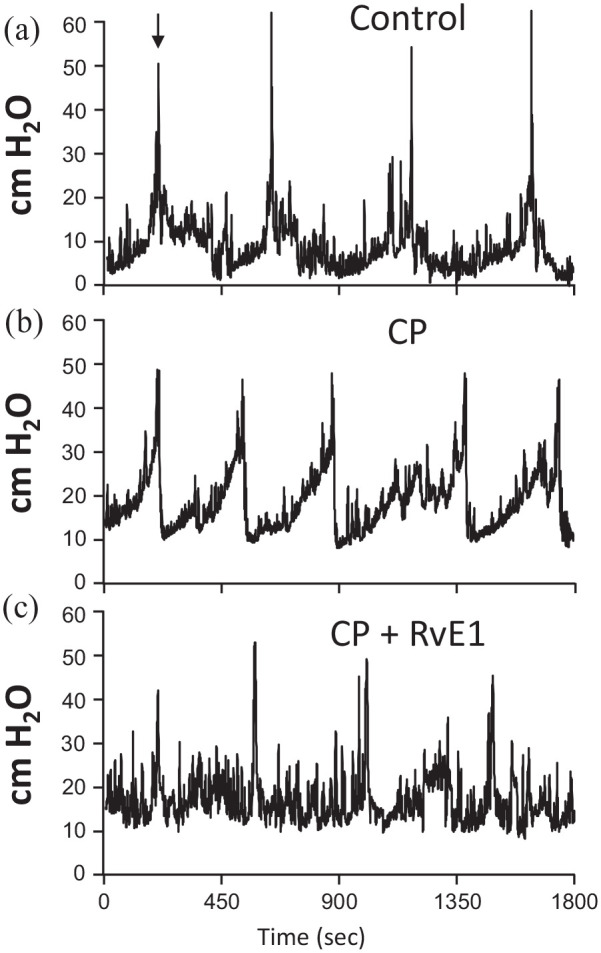
Figure 6.

Representative urodynamic pressure tracings from control, CP-treated, and CP + RvE1–treated mice. Shown are intravesicular pressure tracings for each group through several micturition cycles. The tracing is oriented so the first peak of voiding pressure (indicated by an arrow in (a)) in each of the tracings are aligned for ease of comparison. The tracings reveal voiding pressures (the pressure at each peak which corresponds to a void – tracings from the scale that indicate voids are not shown) and the intercontraction interval (time between peaks) which is reflective of voiding frequency: (a) control untreated mice (saline and PBS only), (b) CP-treated mice (CP and PBS only), and (c) CP + RvE1 – treated mice (CP and RvE1).
