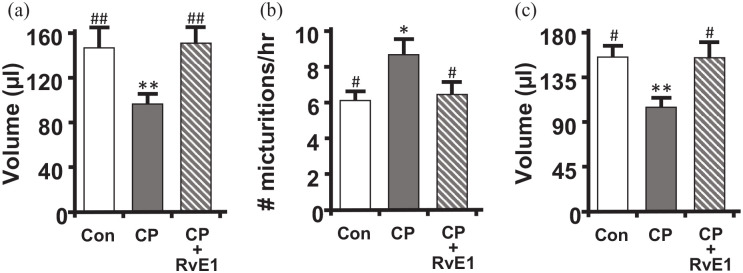
Figure 7.
RvE1 restores urodynamics parameters to control levels following CP treatment. Following the treatment paradigm shown in Figure 1, mice were subjected to urodynamics. Recordings were analyzed using Med-CMG software (Catamount, Inc., St. Albans, VT). Typically 5–10 individual micturition cycles were quantitated per animal and averaged for n = 1. (a) Average voided volume for each of the three groups. (b) Voiding frequency (number of voids divided by total time for those cycles), for each of the three groups. (c) Bladder capacity (the average voiding volume from the 5–10 individual micturition cycles analyzed for a single mouse added to the recovered postvoid residual volume of that mouse). Data are the mean ± SEM for all graphs. n = 9, 10, 9, for all, respectively. *p < 0.05, **p < 0.01 compared to control (Con – saline and PBS only treated mice) by ANOVA and Student–Newman–Keuls. #p < 0.05, ##p < 0.01 compared to CP (CP – injected with CP and saline only) by ANOVA and Student–Newman–Keuls.

