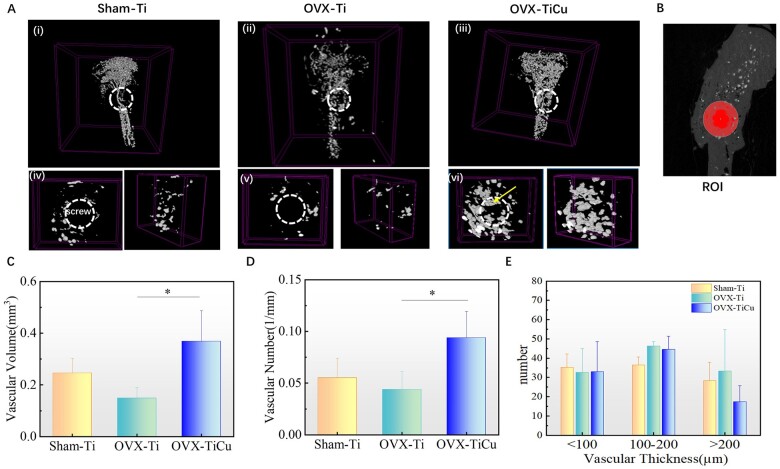
Figure 2.
Micro-CT analyses of bone vessels after 4 weeks of screw implantation: (A) micro-CT scan modeling; (B) ROI for analysis; and (C–E) quantitative analysis results of volume, number and thickness distribution of blood vessels in ROI. The data were expressed as mean±SD. n = 7 in panels (C) and (E). *P < 0.05

