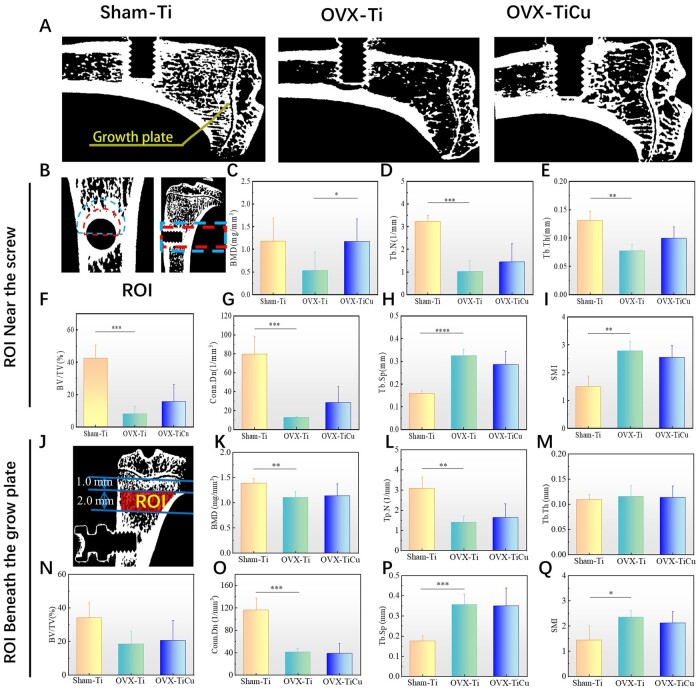
Figure 3.
Micro-CT analyses of bone structure after 8 weeks of screw implantation: (A) micro-CT scans on Sham-Ti, OVX-Ti and OVX-TiCu groups, respectively; (B and J) ROI for analyses; and (C–Q) quantitative analyses of bone structure parameters. Data were expressed as mean±SD. n = 8 in panels (C) and (I). *P < 0.05, **P < 0.01, ***P < 0.001

