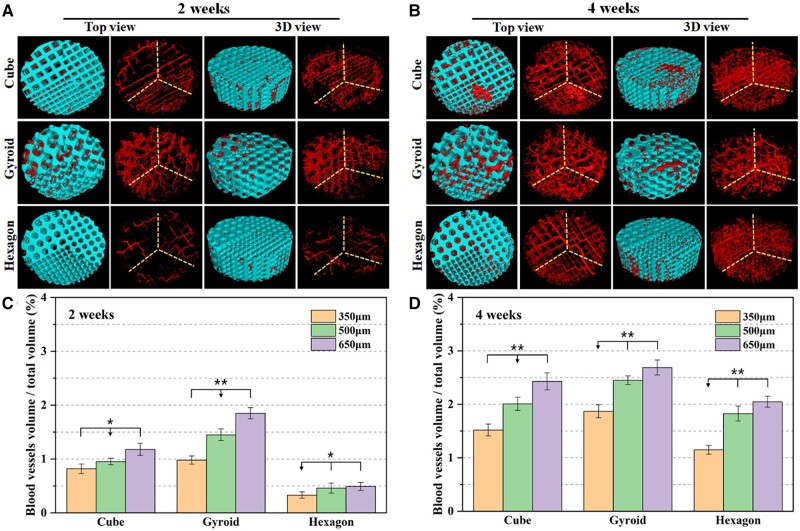
Figure 6.
Representative Micro-CT top and 3D view images of micro-angiographic implants at 2 weeks (A) and 4 weeks (B) post-implantation. Blue: bioceramic scaffolds; red: blood vessels. Quantitative data of blood vessels BV/TV in the micro-angiographic implants at 2 weeks (C) and 4 weeks (D) postoperatively based on Micro-CT reconstruction analysis (*P < 0.05, **P < 0.01).

